

27/12/2024
Abstract
Nowadays, most of the domestic solid waste (DSW) discharged by humans in urban areas has been collected, but some of it is still leaked and discharged into the environment. Therefore, assessing the amount and composition of waste leaked into the environment is necessary in the context of increasing environmental concerns. The study applied the survey and data analysis method to assess the amount and composition of waste leaked in Phu Nhuan district, Ho Chi Minh City. The research results recorded: On land with 35 survey locations with a total survey area of 2.600m2, 1.849 pieces of garbage were collected, an average of 0,71 pieces/m2. For garbage, fragments accounted for 54%, intact garbage accounted for 46%. Plastic waste is the most commonly found material, accounting for 49% of fragmented waste and 22% of intact waste. Of these, waste in size number 3 (from 2cm x 2cm, smaller than 4cm x 4cm) was found the most, accounting for 47%. The total number of garbage audited on the river was 2.161 pieces of garbage, of which 2.083 were fragmented and 78 were intact. 100% of intact garbage was plastic, while 95% of fragmented garbage was plastic. The most garbage found on the river was styrofoam food containers, accounting for 27%, followed by plastic bags, accounting for 26%, and food labels, accounting for 17%. The research results showed that plastic waste is currently the component with the highest proportion in surveys on land or garbage collected on the river. From there, the research team proposed a number of measures to limit garbage and plastic waste from leaking into the environment.
Keywords: Plastic waste, Solid waste, Waste leaked into the environment.
JEL Classifications: P18, Q53, Q56.
Received: 2nd August 2024; Revised: 22nd August 2024; Accepted: 16th September 2024.
1. INTRODUCTION
Most municipal solid waste (MSW) generated by urban residents is collected, but a portion remains uncollected, leaking and being emitted into the environment. This waste is discarded on land and streets and influenced by human activities and environmental factors, it eventually flows into canals, rivers, and streams, ultimately reaching the oceans. According to the 2016-2020 National Environmental Status Report, it is estimated that Vietnam is discharging around 60,000 tons of household waste into the environment every day, with an annual increase of 10%. It is estimated that about 15% of this waste is recycled or reused. The remainder is either buried in landfills, discharged into water sources, or burned in conventional waste disposal methods. The volume of plastic products used annually has increased from 3.8 kg per person in 1990 to 41,3 kg per person in 2018. The amount of plastic waste generated from MSW in Vietnam in 2021 was 8.021 tons per day, equivalent to approximately 2.93 million tons per year. The amount of plastic waste has been on the rise in recent years (approximately 2,7 million tons in 2018, 2,83 million tons in 2019, and around 2,93 million tons in 2021) [1].
Ho Chi Minh City is the largest urban area in Vietnam, with a population of about 9 million people. It is estimated that the city generates approximately 9.800 tons of MSW daily, with an annual growth rate of about 6-10% [5]. The average per capita waste generation rate is about 0,98 kg per person per day. With a collection rate of 91%, it is estimated that nearly 900 tons of waste remain uncollected every day. This uncollected waste is dispersed into the environment, flowing through canals, rivers, and eventually into the sea. Due to the tropical and subtropical climate, plastic waste is prone to degradation into small fragments and microplastics, which can easily escape into the environment.
Many studies have been conducted on the current status of solid waste management in Ho Chi Minh City. However, few have assessed the amount of solid waste that leaks or escapes into the environment. Phu Nhuan District, located 4,7 km northwest of the city center, is one of the central districts of Ho Chi Minh City. It serves as a gateway to the northern part of the city. Phu Nhuan District covers an area of 4,88 km² with 13 wards and a population of approximately 195.743 people (as of June 2023). The Nhieu Loc – Thi Nghe canal flows through the district. With a waste generation rate of 0,98 kg per person per day, it is estimated that the district must collect approximately 191 tons of waste per day. Therefore, this study was conducted to assess the amount and composition of waste leaking into the environment in Phu Nhuan District. Choosing Phu Nhuan as a study area is considered representative of the inner-city districts of Ho Chi Minh City.
2. RESEARCH METHODOLOGY
2.1. Survey Time and Location
Survey Period: From May 19th, 2024, to May 21st, 2024.
Location: The survey was conducted at 35 points within Phu Nhuan District and some neighboring areas of Phu Nhuan District, Ho Chi Minh City, Vietnam.
2.2. Research Methodology
2.2.1. Survey Method
Inland area survey method
The field data was collected according to the inland survey guidelines in the document "Manual on Ocean Waste Monitoring Methods, Part I and Part II" [3][4], developed by the Commonwealth Scientific and Industrial Research Organisation (CSIRO) with the support of the Coordinating Body for the Seas of East Asia (COBSEA) and the United Nations Environment Programme (UNEP) through the SEA Circular Project, funded by the Swedish Government. The following steps were undertaken:
Step 1: Site Selection: Survey sites were randomly selected on a map by placing a 500-meter grid over the study area and choosing the center of each 500m x 500m grid square. A total of 30 to 40 sites were selected. The survey area covered not only Phu Nhuan District but also nearby districts such as District 10, District 1, Binh Thanh District, Go Vap District, Tan Binh District, and District 3.
Step 2: Selection of Transects: A total of 3 to 6 transects were surveyed at each site. Transects on land were 25m² in area (12,5m x 2m or 25m x 1m) and were selected based on the main land uses in the survey area. The transects were spaced at least 30-50 meters apart. In this study, 104 transects were surveyed across 35 selected sites in Phu Nhuan District.
Step 3: Conducting the Survey:
1. Upon arriving at the designated GPS survey point, fill out the Inland Survey Area Information form, take photos, and record GPS coordinates.
2. Define the transect areas for the survey at the site:
- At each site, 3-6 transects were randomly selected for the survey. If no waste was found after completing the third transect, the survey continued until at least one piece of waste was found or all 6 transects were surveyed.
- If the site contained different types of land use, the transects were selected to represent the diversity of land uses (e.g., parks, roadsides, grassy areas, parking lots, etc.). Each transect had an area of 25m², and the dimensions could be 2m x 12,5m or 1m x 25m.
- The distance between transects should be at least 30m.
3. Mark the survey transect area with a measuring tape:
- Identify the starting point of the transect and use a random method to determine the direction of the transect.
- Use the measuring tape to mark the transect from the starting point to the end, dividing each side by 1 meter. When placing the tape, ensure it follows an arc to maintain the waste's current condition.
4. Complete the Transect Data Form and take a photo of the transect starting point.
5. Record the transect's length. Divide the transect into 10 equal sections and record the data for each section in the Object Catalog Form.
6. Move along the transect to identify, find, and count waste:
- Each transect is surveyed by a group of 3 people: 1 person recording data and 1-2 people conducting the survey. After marking the transect and setting the measuring tape, the surveyors will stand at the 0-meter point at each side of the tape.
- The length of the transect is divided into 10 sections. Each section is surveyed sequentially from 1-10. Each section is marked with a 1-meter-long string at the end of each section.
- Starting at each section, the surveyor will identify and report the first piece of waste seen, measure its size, and announce its position. The waste size is measured using a size chart, selecting the box that can fit the longest diagonal of the waste.
- Waste is categorized as either intact or fragmented.
Example: "Section 1, metal bottle cap, intact, at position 0,5m, size 2."
After the first piece, the surveyor will continue to identify and report the remaining waste, but without mentioning position or size for the subsequent pieces. Example: "Section 1, 2 metal bottle caps, intact."
Note: The surveyor only surveys each section once and does not go back to search for additional waste.
7. The recorder will log all data into the Object Catalog Form:
- The recorder will stand outside the survey area and record the data announced by the surveyor.
- At the beginning and end of the search, record the GPS coordinates and take panoramic photos of the transect from both ends.
The image below is an example of a survey site with four types of terrain/environment with different land use purposes: sidewalk, roadside, park, and bus stop.
The first transect is placed in the park, which has the largest area. The second transect is placed on the sidewalk, the second-largest area, and another transect is placed along the pathway.
If no waste is found in these areas, then additional transects numbered 4, 5, and 6 must be added. These should be placed in any types of terrain/environment that have not been surveyed yet, and then additional cross-sections should be added in proportion to the types of environments in the area. In the example above, a fourth transect can be added around the bus stop, the fifth transect in the park, and the sixth transect along the sidewalk.
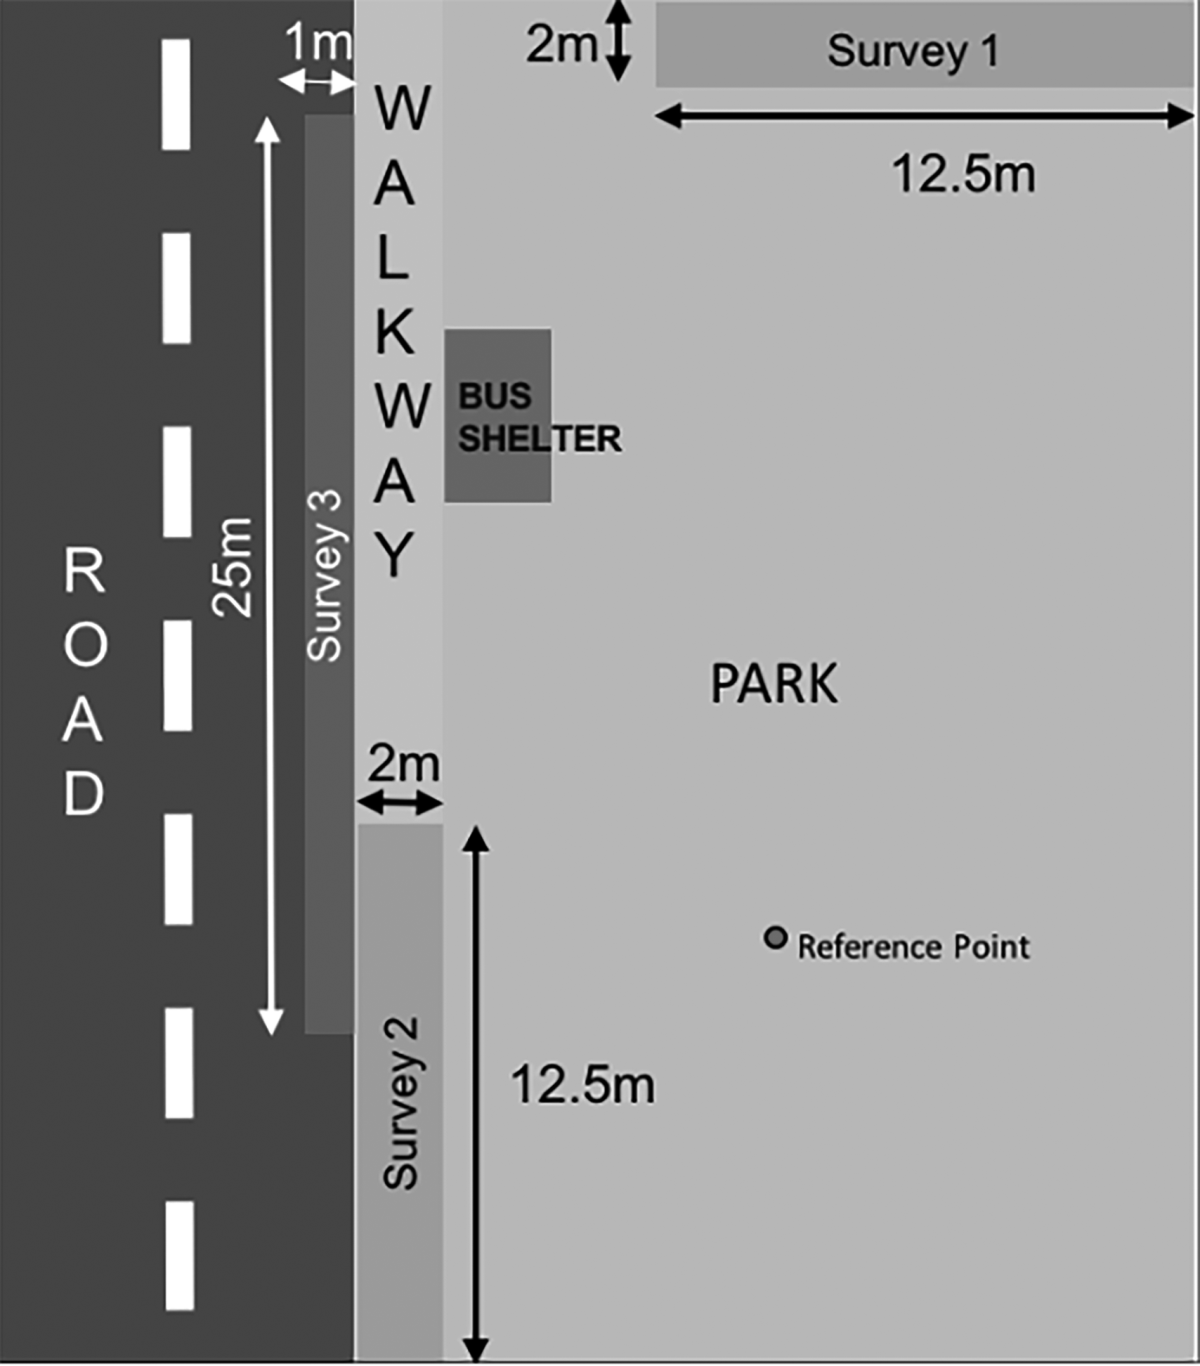
Hình SEQ Hình \* ARABIC 1. Lựa chọn mặt cắt
Research methodology for the river area
Due to the Nhieu Loc – Thi Nghe canal being lined with vertical embankments, perpendicular to the river’s surface, the research team was unable to access the area for the survey following CSIRO’s standard method. Therefore, the research team modified the methodology to better suit the current conditions of the area and available resources. The method applied for the study in this area is based on waste auditing techniques.
To assess the composition of waste, the research team used the ¼ method (as outlined in the "Solid Waste Management and Treatment Textbook," Nguyen Van Phuoc, 2008). The sample is taken after mixing and heaping the waste, and then sorting and counting each type of waste that makes up 10% of the total waste volume. The team took 10% of the waste recovered from the river (equivalent to 2 containers of 660L) to carry out the audit. The audit was conducted using the waste collection information categories provided by CSIRO.
Steps for Execution: Start by emptying the trash from the container onto a large tarpaulin, and remove the organic waste. After the organic waste has been separated, the remaining waste is categorized into distinct types according to the list, with each type placed into separate styrofoam boxes. Then, count the number of waste pieces in each styrofoam box and record the results on a category sheet. Finally, compile and summarize the data.
2.2.2. Data analysis method
All survey data were recorded electronically using the ODK Collect data entry application. The data was then exported into an Excel file, containing the recorded information from the survey, such as the number of waste pieces, waste types, etc. The data was coded numerically and processed statistically based on waste size, waste type, and percentage distribution.
3. RESEARCH RESULTS
3.1. Results from Inland Area Survey
3.1.1. Overview of waste situation
The research team conducted surveys at 35 points spread across Phu Nhuan District and nearby districts [6]. Among the 35 survey points, the predominant land uses were: 66% roads and traffic areas; the second most common was 20% commercial and urban areas, while 9% were residential areas and 6% were parks (Figure 1).
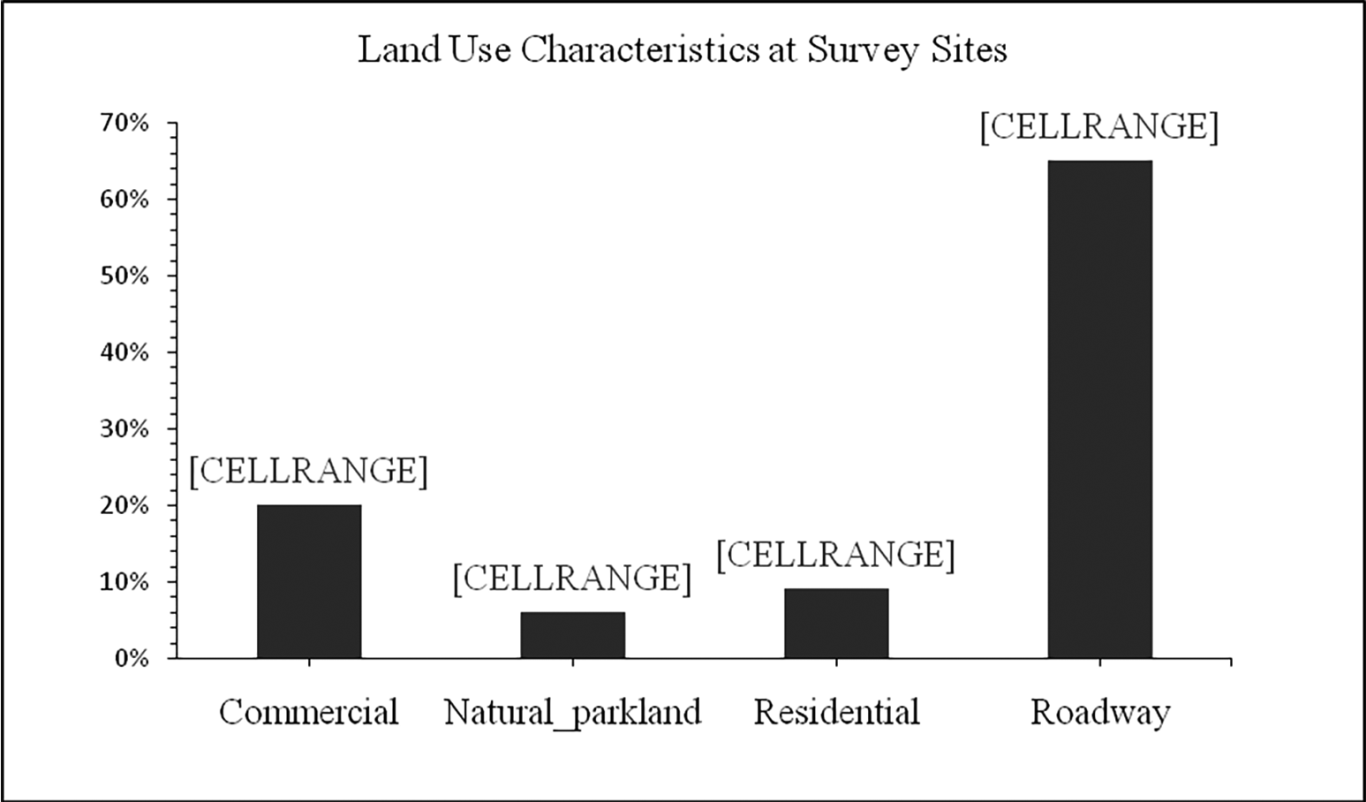
Figure 1: Land use characteristics at survey sites
At each site, three transects were surveyed, making a total of 104 transects. Of these, 56% of the survey areas were roads used by motor vehicles (motorbikes, cars, etc.), 37% were pedestrian walkways (sidewalks), and 8% were park areas (grass fields, etc.) (Figure 2).
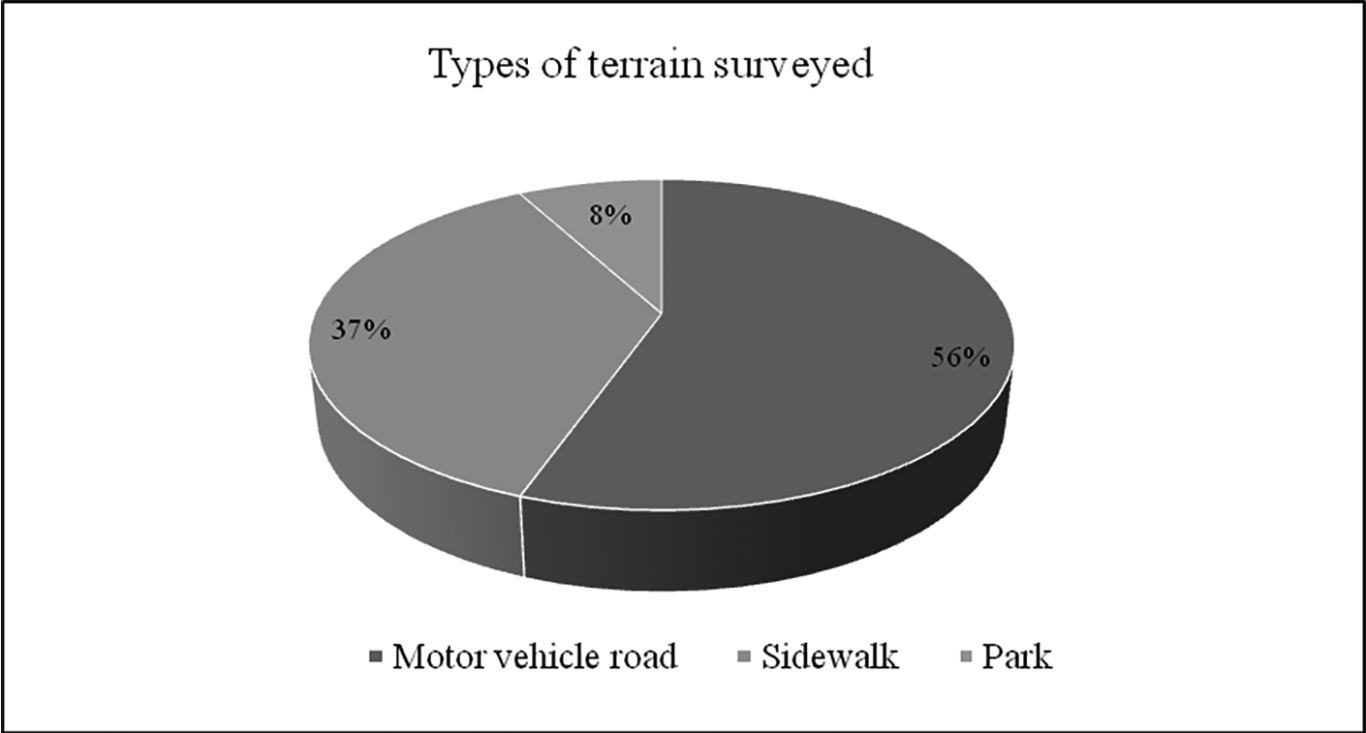
Figure 2: Proportion of Surveyed Terrain Types
For the 35 survey points, the research team covered a total area of 2.600 m² across Phu Nhuan District and some neighboring districts. A total of 1.849 waste pieces were collected, including both fragmented and intact waste pieces of various sizes, with an average of 0,71 pieces/m².
Regarding fragmented waste, 995 pieces (54%) were found, originating from 9 different material types, including plastic, paper, metal, fabric, mixed waste, glass, rubber, wood, and others. Among these, plastic was the most common material, with 484 pieces, accounting for 49% (Figure 3).
Among the 10 most commonly found fragmented waste items, paper/cardboard was the most frequently found type, with 150 pieces, representing 21% of the total fragmented waste. The second most common was plastic bags, with 98 pieces, accounting for 14%. The third most common was unidentified hard plastic items, with 66 pieces, making up 9%. In the top 10, plastic materials were also the most frequently found, accounting for 43% (Figure 4).
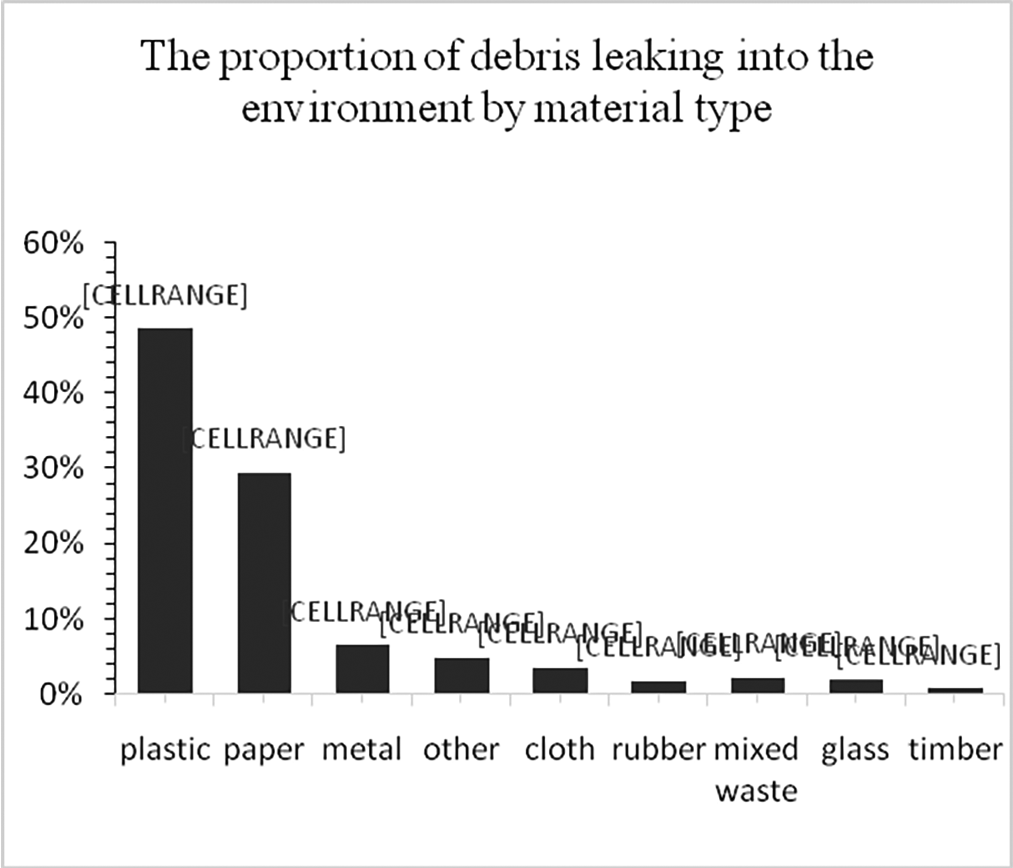
Figure 3: The percentage of debris leaked into the environment by material type
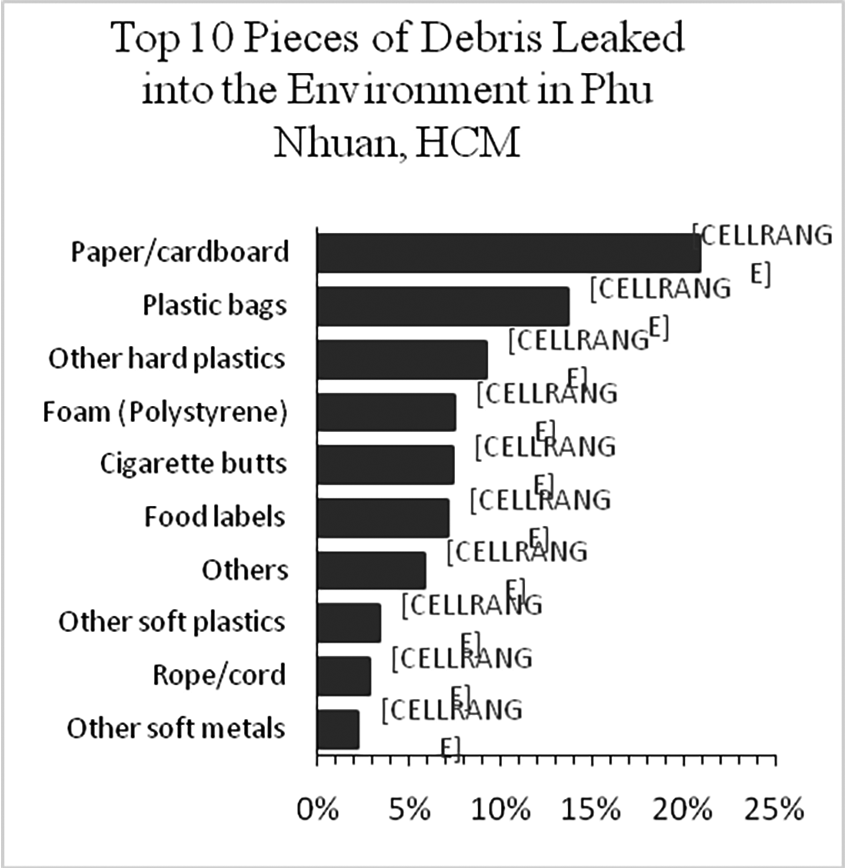
Figure 4: Top 10 pieces of debris leaked into the environment in the Phu Nhuan area, HCM City
Regarding intact waste, 854 pieces (46%) were found, distributed across 9 common material types. Unlike the fragmented waste, intact waste had paper as the most common material, with 540 pieces, accounting for 63%. The second most common material was plastic, with 185 pieces, making up 22%. The remaining materials were all found in quantities of 6% or less (Figure 5).
Among the 10 most frequently found intact waste items, cigarette butts (classified under paper) ranked first with 495 pieces, accounting for 58%. The second most common was paper/cardboard with 37 pieces (4%), followed by other rubber items (36 pieces), plastic bags (34 pieces), and food labels (30 pieces). The remaining items were found in quantities of less than 2% (Figure 6).
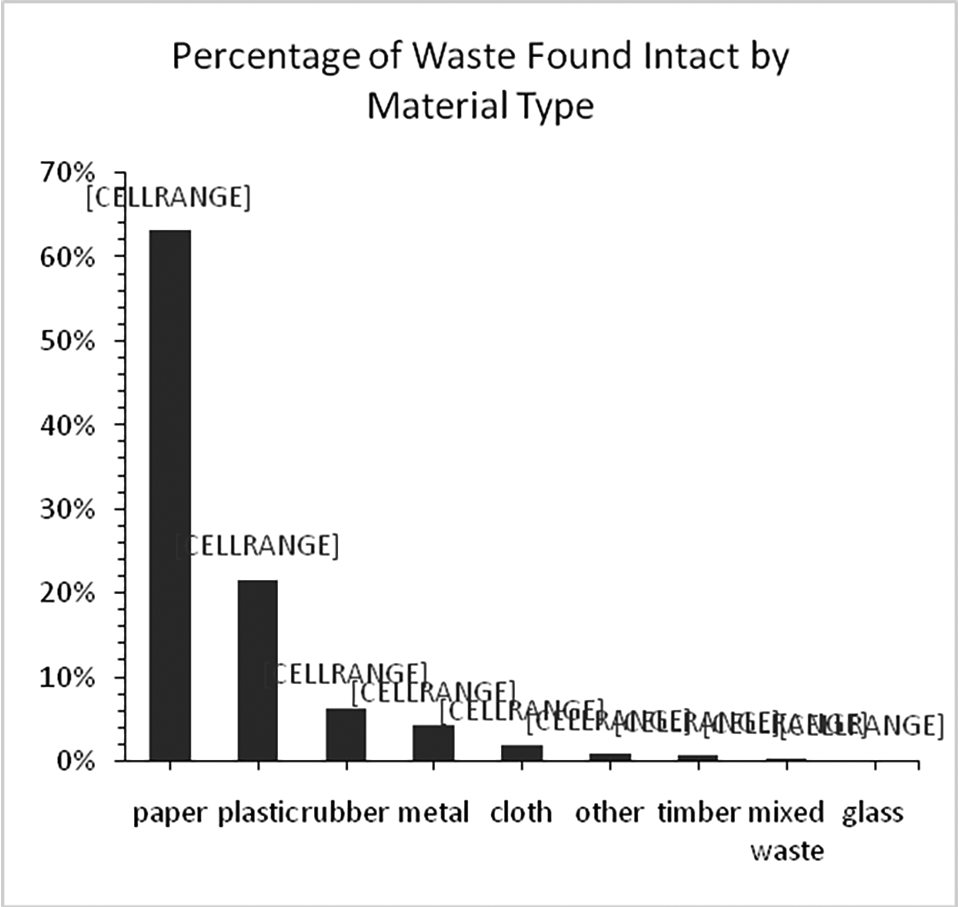
Figure 5: The percentage of intact waste found by material type
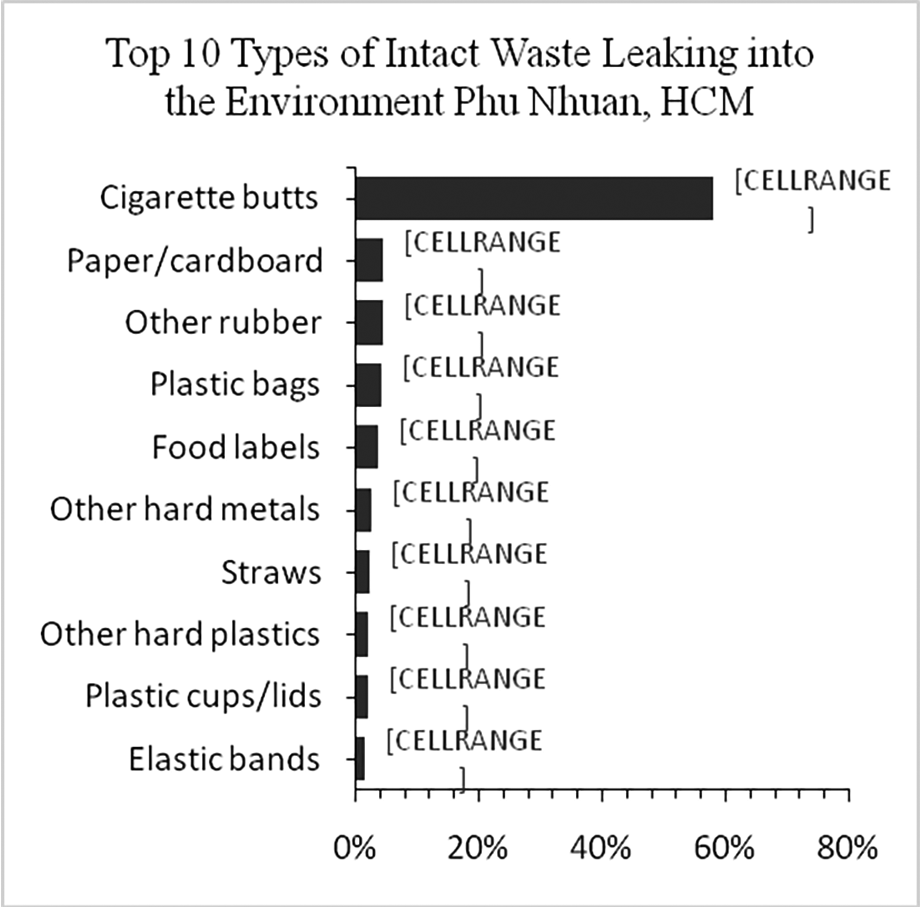
Figure 6: Top 10 types of intact waste leaked into the environment in the Phu Nhuan area, HCM City
Of the 582 pieces of waste found during the survey, the waste sizes, including both fragmented and intact types, ranged across seven sizes, from 1 cm² to 22 cm². Among these, size category 3 (ranging from 2 cm x 2 cm, smaller than 4 cm x 4 cm) was the most commonly found, accounting for 47%. Size category 4 (ranging from 4 cm x 4 cm and smaller than 8 cm x 8 cm) was the second most common, comprising 17%. The remaining sizes, category 5 and category 2, made up 12% and 11%, respectively, while the other sizes accounted for less than 7% (Figure 7).
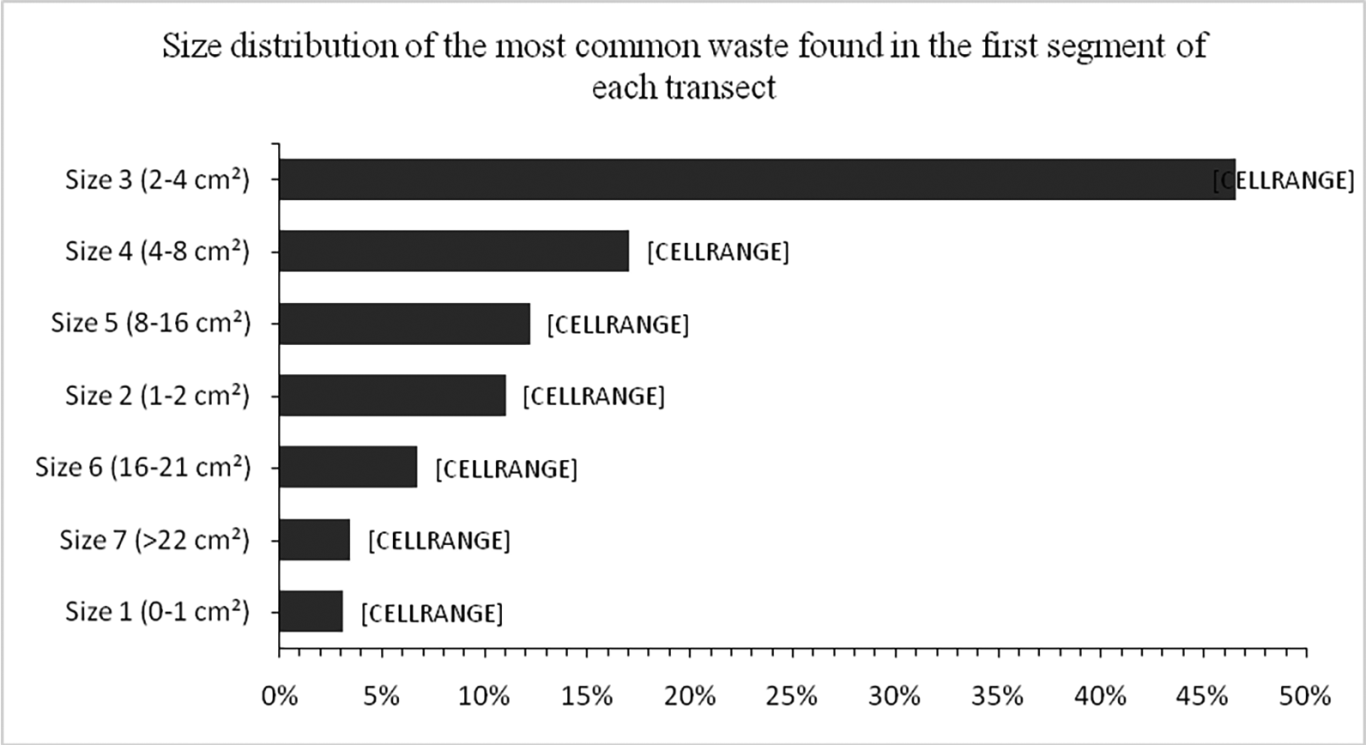
Figure7: Proportion of common waste sizes found in the first segment of each transect
This statistical data aligns with the reality that large pieces of trash are collected for recycling scrap sales. Smaller pieces are often discarded because they have no economic value, or they are spilled during collection due to their small size, making sweeping with a broom ineffective
3.1.2. Correlation of waste across survey points
At the 35 different survey locations, the number of waste pieces counted varied, ranging from 13 to 183 pieces per point. Among the areas with higher waste counts (over 100 pieces), the following locations were noted: Location 32 had 183 pieces, Location 34 had 139 pieces, and Location 26 had 133 pieces. These locations are situated on major traffic routes with high pedestrian traffic, and the sidewalks are areas where daily commercial activities take place. For example, Location 32 is on Pham Van Dong Street, while Location 26 is along Nguyen Thuong Hien Street.
Conversely, areas with fewer waste pieces (under 20 pieces) included: Location 6 with 13 pieces, Location 27 with 14 pieces, and Location 2 with 17 pieces. These are locations that have daily cleaning activities, such as Location 27 in Gia Dinh Park and Location 2 near a foreign language center (Figure 8).
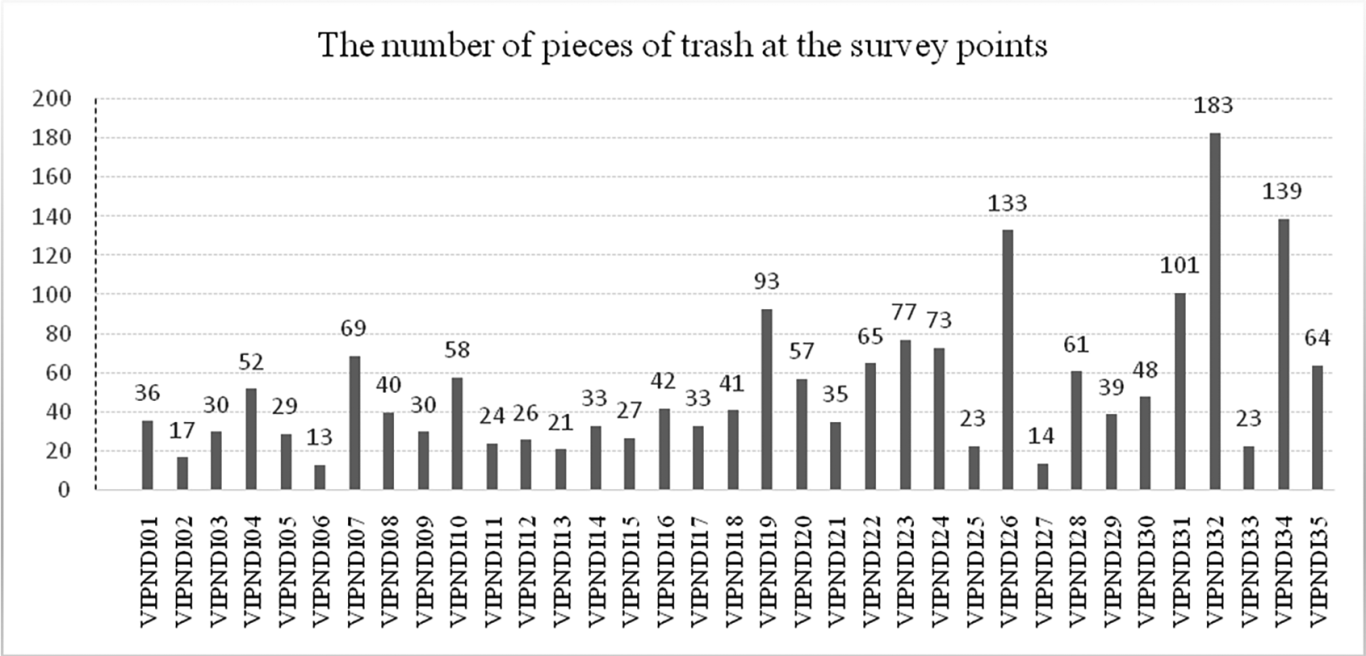
Figure 8: Number of pieces of waste at survey locations
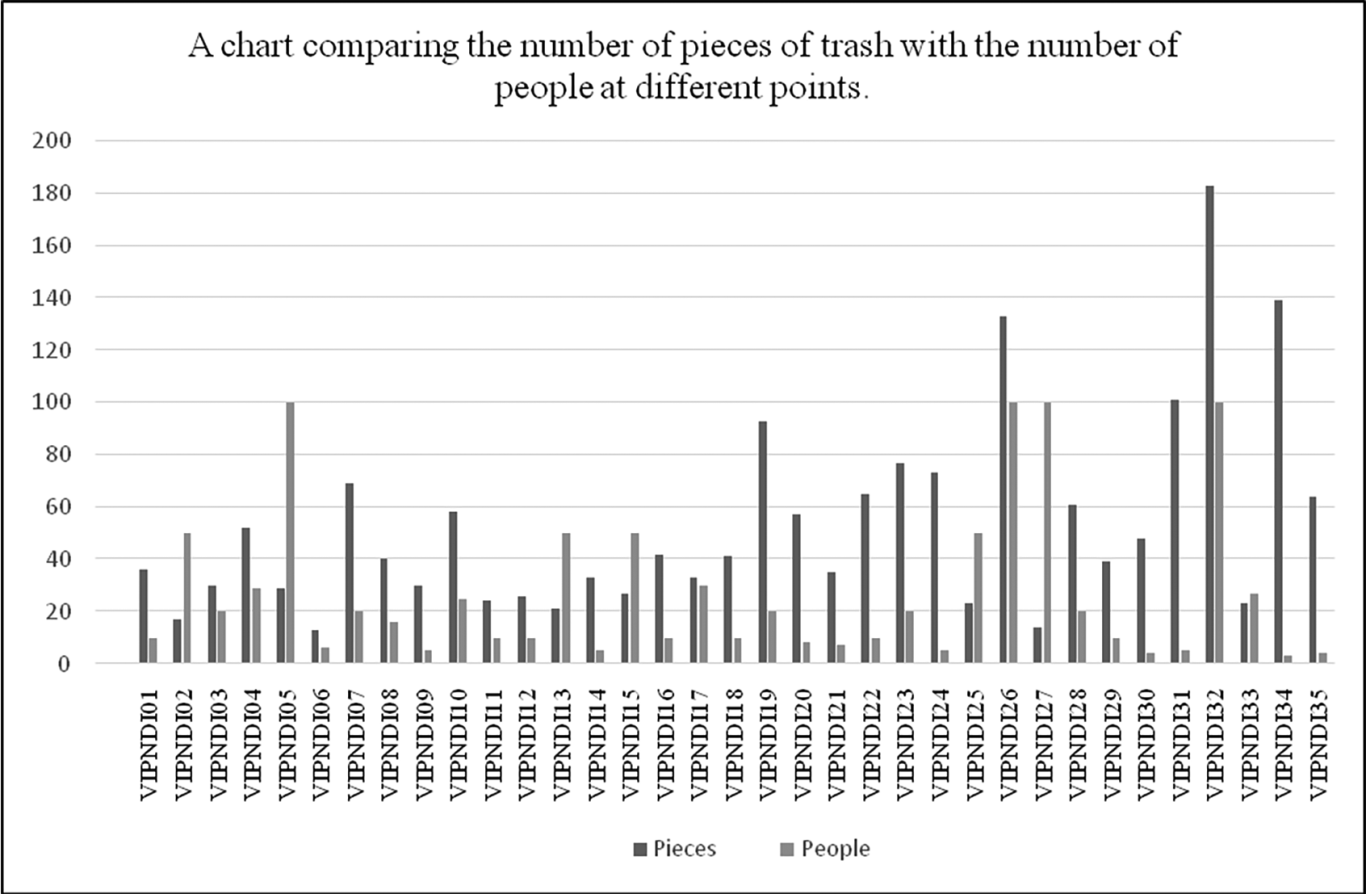
Figure 9: Comparison of the Number of Waste Pieces with the Number of People at the Survey Points
The number of people counted at the survey points can also be considered as a correlation, where areas with higher population densities tend to have a greater amount of waste leaking into the environment. For example, at the point VIPNDI32 (Pham Van Dong Street, Ward 1, Go Vap, Ho Chi Minh City), the highest amount of waste leakage found corresponds with the highest pedestrian traffic (100 people). This location is a densely populated residential area with many businesses selling food, drinks, and various goods.
On the other hand, there are cases where this correlation does not hold. For example, at location VIPNDI05, where the count of people is 100, but only 13 pieces of waste were found (the lowest); or at VIPNDI34, where only 3 people were counted, but 139 pieces of waste were found (second highest). These variations could be due to factors such as the frequency of cleaning in the surveyed areas, the awareness and behavior of local residents, and other local conditions (Figure 9).
3.1.3. Comparison with findings from other studies
Table 1: Percentage composition of waste in urban areas in Vietnam
|
Component |
Other Urban Areas in Vietnam |
Hanoi |
Hai Phong |
|
Organic Waste |
50,2% - 68,9% |
51,9% |
46% - 49,8% |
|
Plastic and Nylon |
3,4% - 10,6% |
3,0% |
12,2% - 14,2% |
|
Paper and Cardboard |
3,3% - 6,6% |
2,7% |
3,8% - 4,2% |
|
Metals |
1,4% - 4,9% |
0,9% |
0,1% - 0,2% |
|
Glass |
0,5% - 2,0% |
0,5% |
0,8% - 0,9% |
|
Inert Waste |
14,9% - 28,2% |
38,0% |
23,9% - 24,7% |
|
Rubber and Leather |
0% - 5,0% |
1,3% |
0,60% |
|
Plant Waste |
1,5% - 2,5% |
- |
- |
|
Hazardous Waste |
0% - 1,0% |
- |
- |
|
Other Components |
- |
Textiles 1.6% |
8,6% - 10,5% |
Source: World Bank, 2018
The results of the study survey indicate that the data collected by the research team is consistent with the data in the 2018 World Bank report (Table 1) [6]. According to the World Bank's data (excluding organic waste), plastic waste represents the largest proportion, followed by paper waste, and thirdly, metal waste. This suggests that the CSIRO survey method employed by the research team is highly suitable for assessing waste leakage into the environment in urban areas. This method can be used to evaluate other regions and serves as a reference for policymakers, local authorities, and the public in waste management and consumer recommendations.
3.2. Results of river area survey
The waste audit data for the river area shows a total of 2.161 waste items, including 2.083 fragmented waste items and 78 intact waste items. All of the intact waste was plastic, consisting of 62 bottle caps, 14 drinking water bottles, and 2 other bottles. Among the fragmented waste, 95% was plastic, 3% was paper, 1% was glass, and 1% was processed wood (Chart 10).
Among the plastic waste found, the most common item was food containers made from styrofoam, with 565 pieces (27% of the total fragmented waste). The second most common was plastic bags, with 542 pieces (26%). Third was food labels, with 352 pieces (17%), and fourth was plastic eating utensils, with 227 pieces (11%). Other items found in smaller quantities included plastic cups/lids, straws, paper/cardboard, other hard plastics, various bottles, and water bottles, each accounting for less than 10% of the total (Chart 11).
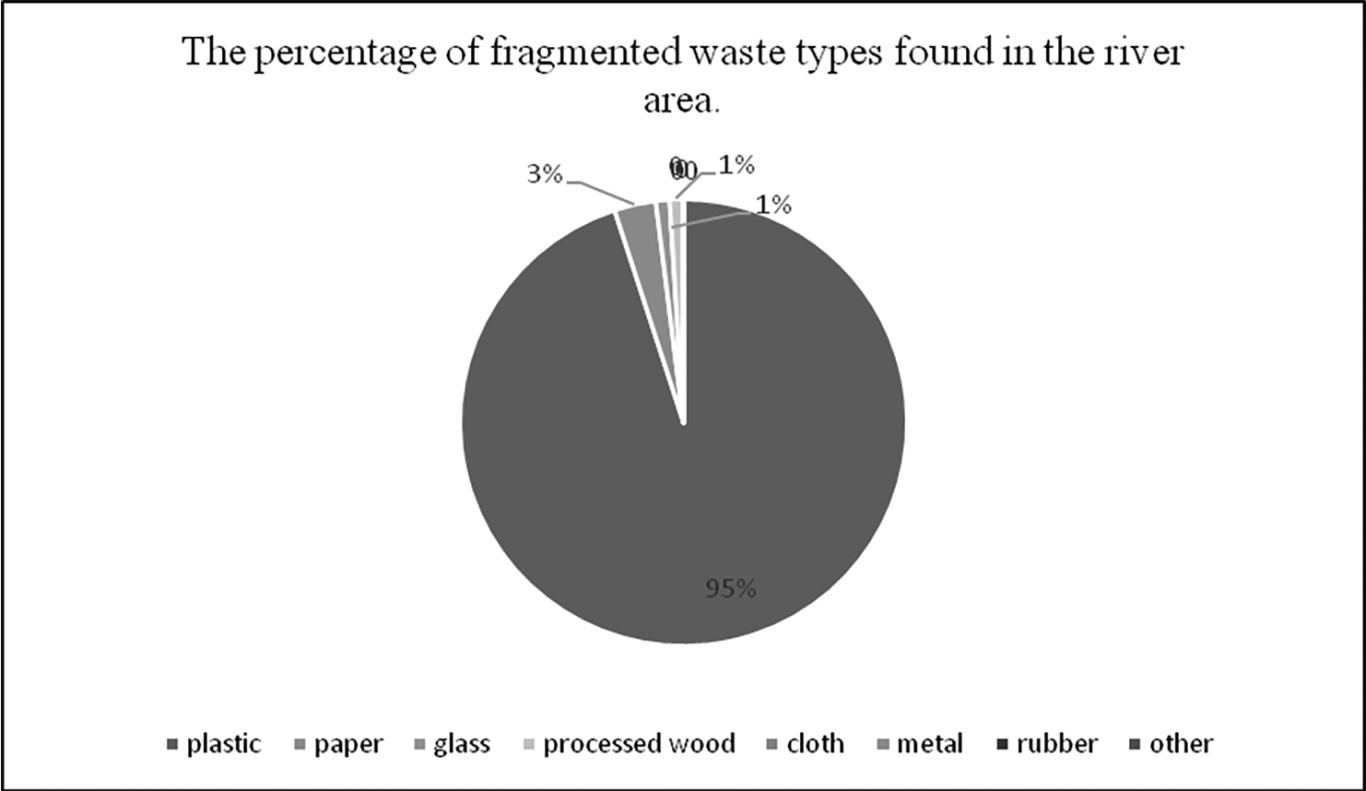
Figure 10: The percentage of fragmented waste types found in the river area
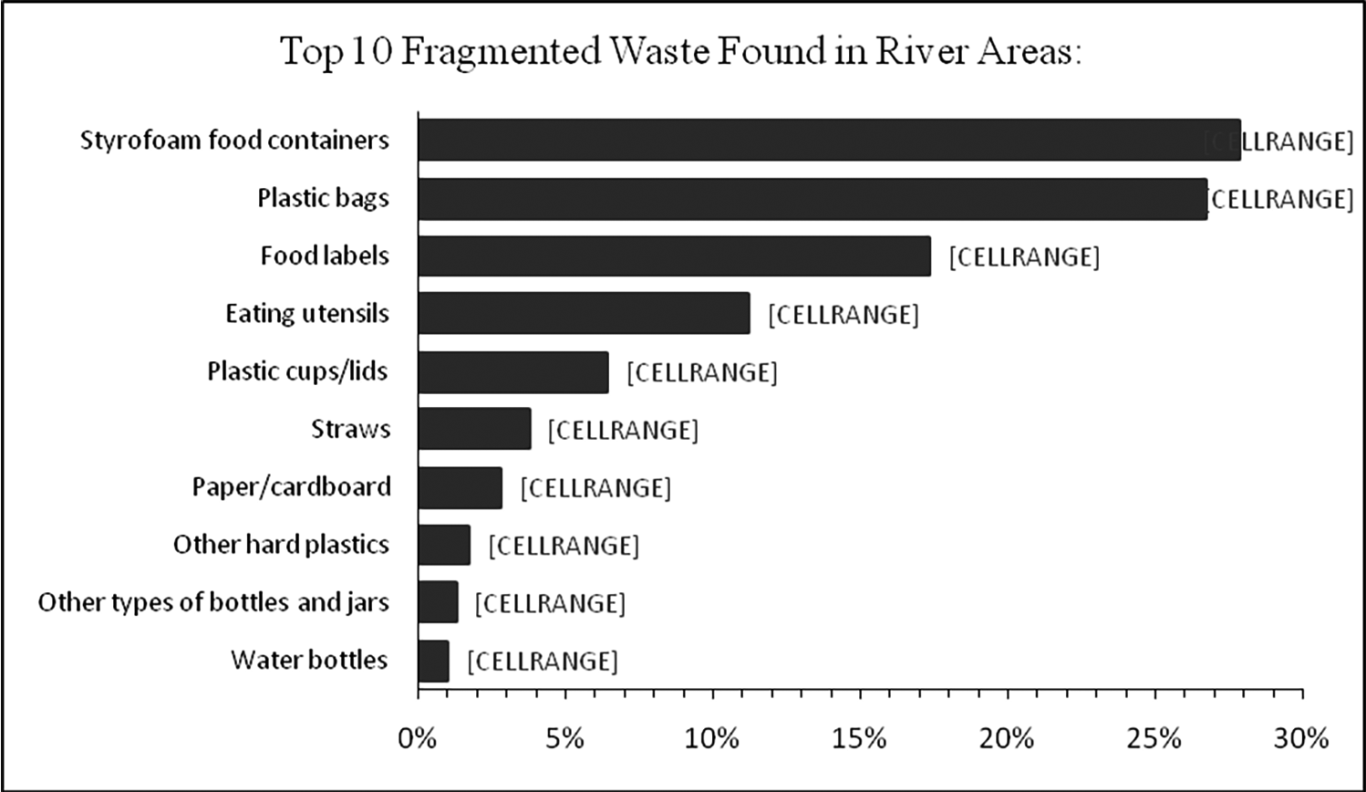
Figure 11: Top 10 fragmented waste items found in the river area
This shows that plastic waste in the river accounts for a very large proportion - over half of the drifting waste is plastic. Compared to the data collected from the land survey, the percentage of plastic waste in the river is much higher. During the survey, the research team observed that the majority of the plastic waste consisted of single-use plastic products, such as plastic bags, food packaging bags, water bottles, straws, plastic spoons, and various packaging materials like candy wrappers and milk cartons. Foam waste was primarily composed of foam food containers and packaging, with some pieces being broken remnants of foam boxes.
4. CONCLUSIONS AND RECOMMENDATIONS
4.1. Conclusions
With 35 survey sites covering a total area of 2.600 m², the research team collected a total of 1.849 pieces of waste, including fragmented and intact waste items of various sizes, with an average of 0,71 pieces per m². Of the fragmented waste, 995 pieces were found, accounting for 54%, with plastic being the most prevalent material, comprising 49%. For the intact waste group, 854 pieces were found, making up 46%. Unlike fragmented waste, the most common intact waste was paper, with 540 pieces (63%). In the river audit, a total of 2.161 pieces of waste were recorded, with 2.083 pieces being fragmented and 78 pieces being intact. The intact waste was 100% plastic, consisting of 62 bottle caps, 14 drinking water bottles, and 2 other bottles. Of the fragmented waste, 95% was plastic. The research team observed that the plastic waste primarily consisted of single-use plastic products that people commonly use daily, such as plastic bags, food packaging bags, water bottles, straws, plastic spoons, and various packaging materials such as candy wrappers, milk cartons, and foam containers used for meals or food. Additionally, some foam waste was broken fragments of foam containers.
4.2. Recommendations
Policy solutions:
Strengthen monitoring and enforcement of waste sorting activities to ensure proper waste disposal in designated areas. This will help to change people's behavior in the surveyed areas. It is essential to promote waste sorting programs and raise environmental awareness through campaigns in offices, schools, shopping malls, and supermarkets to encourage better waste management and establish good habits for waste collection and disposal.
Implement street cleaning and waste collection programs for public areas such as roads, sidewalks, and alleys to reduce littering in the environment. Additionally, the use of street sweeping and vacuum trucks could improve the efficiency of waste removal, ensuring that litter is more thoroughly collected and reducing the amount of waste discarded carelessly.
Increase recycling and reuse efforts for materials like plastic, paper, and organic waste. In parallel, reduce and gradually replace single-use plastic products with more eco-friendly alternatives, such as those made from sugarcane bagasse, coffee grounds, coconut husks, etc.
Implement quotas on the production of single-use plastics, increase taxes on plastic products, and impose taxes on other plastic goods. Expand the responsibility of producers regarding the disposal of their products, even after they become waste. Establish a roadmap for waste sorting at the source to facilitate collection, recycling, and reuse of waste. Proper source separation will pave the way for a circular economy regarding waste, which is the best approach to transform waste into valuable resources.
Public awareness solutions:
Increase public education on waste reduction, recycling, and the importance of not littering in order to cut down on the demand for single-use plastics. This will help minimize littering that contributes to waterway pollution and ocean contamination.
Promote campaigns such as "No littering in the streets or rivers, for a cleaner city and reduced flooding" to encourage people to keep the environment clean and build a community culture of environmental protection.
Raise awareness among the public, especially the younger generation, through comprehensive long-term efforts that maximize the reach of media channels and press coverage. In tandem with awareness-raising activities, provide the public with the necessary tools and knowledge to sort waste easily (such as proper bins and designated disposal areas).
The research only counted visible plastic waste, so further studies should be conducted to assess the full impact of plastic pollution. These should include studies on microplastic particles in soil and water environments and the concentrations of microplastics found in living organisms within these ecosystems. In the future, research should be expanded to assess the impact of waste on human health, especially plastic waste, and the accumulation of microplastics in food chains. In-depth studies are needed to understand the health implications of microplastic content on humans. This would help inform the ongoing efforts to reduce plastic waste and provide data for future research aimed at assessing trends in environmental pollution by solid waste.
Acknowledgments: This research was conducted with financial, technical support and coordination from the Centre for Supporting Green Development (GreenHub) within the Initiative “Pioneering company, community and consumer responsibility in plastic waste reduction in Vietnam (P3CR)”. This initiative is a part of the Reducing Pollution Project funded by the United States Agency for International Development (USAID), managed and implemented by Winrock International, with the Ministry of Natural Resources and Environment as the governing agency and the Pollution Control Department as the project owner.
Nguyễn Lư Phương1, Ngô Thị Ánh Tuyết1, Nguyễn Thu Hà2
1Ho Chi Minh City University of Natural Resources and Environment,
2Green Development Support Limited Company
(Source: The article was published on the Environment Magazine by English No. IV/2024)
REFERENCES
1. Thanh Nien Publishing House (2023), Report on Plastic Waste Generation in 2022.
2. World Bank (2018), Assessment of the management of hazardous solid waste (HSW) and industrial hazardous waste, strategies and actions to implement the national strategy, 2018.
3. COBSEA & CSIRO (2022). Handbook on Monitoring Methods Ocean Waste, Part I: Bangkok: United Nations Environment Programme. https://drive.google.com/file/d/14yHKTNTbkqwqDxcgkKkkbgSZk2hS20to/view.
4. COBSEA & CSIRO (2022). Handbook on Monitoring Methods Ocean Waste, Part I: Bangkok: United Nations Environment Programme . https://drive.google.com/file/d/14y7mvXN2soUOAe80_FEEMeL5BEG8A9sR/view
5. The Department of Natural Resources and Environment of Ho Chi Minh City, Environmental Status Report of Ho Chi Minh City 2021.
6. Coordinates of 35 Survey Points on Land: https://www.google.com/maps/d/edit?mid=1PKIjG3S6qvteYlqJ0k8RN00lc_EYLok&usp=sharing.