
05/11/2025
Abstract
Practical carbon‑capture options are needed alongside source abatement to meet mid‑century climate goals. Microalgae offer a biological route that operates at ambient conditions while generating valuable biomass; within this portfolio, Spirulina is robust under high pH/alkalinity and compatible with simple photobioreactors. This study evaluates CO₂ capture by Spirulina platensis RIA2 cultivated for 21 days in 8‑L bubble‑column photobioreactors (working volume 5 L) under two aeration modes: ambient Air and CO₂‑supplemented (≈10,000–30,000 ppm). We monitored biomass growth, nitrate and phosphate uptake, and CO₂ fixation (Level A, biomass‑equivalent). CO₂ enrichment accelerated early growth (doubling time ≈ 2.92 days) and produced an earlier biomass peak (1.576 g L⁻¹ on day 11), whereas Air reached a higher peak (3.064 g L⁻¹ on day 16) and maintained a substantially higher cycle‑average biomass. Over 21 days, cumulative fixed CO₂ was 1.047 g CO₂ L⁻¹ with CO₂ supplementation versus 0.864 g CO₂ L⁻¹ with Air, but peak CO₂‑fixation productivity (PCO₂) was higher under Air (0.551 vs 0.395 g CO₂ L⁻¹ day⁻¹). Nitrate decreased more strongly in Air (≈88.9%) than in CO₂ (≈54.5%), while phosphate removal was comparable. Overall, CO₂ supplementation trades early acceleration for reduced late‑phase stability unless pH/nutrient control is applied, whereas Air favors steadier long‑term performance. These findings clarify operational trade‑offs for low‑complexity bubble‑column systems and support pilot integration of algae‑based CO₂ capture near point sources.
Keywords: Spirulina platensis, bubble‑column photobioreactor, CO₂ capture, biofixation, nutrient uptake, productivity.
JEL Classification: Q42, Q55, Q54.
Received:20th August 2025;Revised:10th September 2025; Accepted: 22nd September 2025.
1. INTRODUCTION
Anthropogenic greenhouse-gas emissions remain high despite rapid expansion of renewables and efficiency measures, keeping atmospheric CO₂ on a trajectory inconsistent with mid-century climate targets. Most credible mitigation pathways therefore pair deep source reductions with carbon-capture options that can be deployed across diverse contexts and scales. Within this portfolio, microalgae-based CO₂ capture is a compelling biological complement to engineered systems because it operates at ambient conditions, can co-remove nutrients from wastewater, and yields biomass that can be valorized as food, feed, pigments, or bio-based materials—attributes that improve practical deployability near dispersed point sources (Tripathi et al., 2023). Vietnam provides a particularly pertinent setting: the Government has announced a net-zero greenhouse-gas target for 2050 and submitted an updated Nationally Determined Contribution in 2022 that raises ambition toward 2030, creating policy space to pilot biological capture alongside abatement in power and energy-intensive industries. In such a landscape, modular, low-complexity systems that integrate with existing utilities and offer co-benefits are especially valuable.
Among microalgae, Spirulina is well suited for practical deployment. It thrives at high pH and alkalinity (≈9–10), conditions that naturally suppress contamination, and it accumulates high-value compounds such as phycocyanin and proteins while sustaining robust growth (Vonshak & Tomaselli, 2013; Delrue et al., 2017). Pairing Spirulina with bubble-column photobioreactors (BCBRs) further matches the need for simplicity and effective gas–liquid contact: BCBRs have no internal moving parts, are straightforward to construct and operate at laboratory or pilot scale, and provide adequate mixing and CO₂ dispersion for shear-sensitive cultures (Bégu et al., 2019; Zhao et al., 2023). Nevertheless, operation entails trade-offs. CO₂-supplemented aeration increases inorganic carbon supply and can accelerate early growth, but it also perturbs pH and carbonate–bicarbonate speciation; without control of pH and nutrients, late-phase decline may occur. Conversely, ambient air aeration often enhances long-term stability but may constrain peak productivity. Prior studies report mixed outcomes for A. platensis under CO₂ enrichment or real exhaust, highlighting the need for strain- and system-specific evidence and for transparent carbon accounting that enables comparison across studies (Dębowski et al., 2024; Petrova et al., 2023).
To address these gaps in a context relevant to Vietnamese point sources, this study evaluates CO₂ capture by Spirulina platensis RIA2 cultivated for 21 days in 8-L bubble-column photobioreactors (working volume 5 L) operated under two aeration modes: ambient Air and CO₂-supplemented (approximately 10,000–30,000 ppm). We quantify growth kinetics, CO₂ fixation reported at Level A (biomass-equivalent) using a single explicit conversion factor (1.83 g CO₂ g⁻¹ dry weight, corresponding to a 0.50 carbon mass fraction), and nutrient uptake (nitrate and phosphate) with clear units and dilution factors. By providing a controlled comparison of aeration strategies in a low-complexity BCBR and by linking carbon capture with nutrient dynamics, the study clarifies the balance between early-phase acceleration and long-term stability and offers practical guidance for pilot-ready integration of algae-based CO₂ capture with Vietnamese point sources and emerging carbon-credit mechanisms.
2. RESEARCH METHODS
2.1. Time and place of research
Time and Place of Research was conducted from February 10, 2025 to September 30, 2025 at the laboratory of the Faculty of Natural Resources and Environment, University of Technology - Vietnam National University, Ho Chi Minh City. The experiments were conducted in parallel on two Spirulina platensis microalgae culture models in a Bubble Column Photobioreactor (BCBR). The analytical parameters in all chemicals used in this study were of analytical grade and imported from certified suppliers. The study included temperature , light , pH, phosphate concentration (PO₄³⁻), nitrate (NO₃⁻) and microalgae biomass, measured and analyzed at the Laboratory of the Faculty of Natural Resources and Environment, University of Technology.
2.2. Research subjects
The source of algae used in the study was the ability to determine CO₂ in biomass, the microalgae strain strain Spirulina platensis RIA2 cultured at the Research Institute for Aquaculture II, selected based on its outstanding characteristics of fast growth rate, high CO₂ fixation efficiency and tolerance to high CO₂ concentrations (10,000–30,000 ppm). This microalgae strain has been shown in many previous studies to have great potential in converting CO₂ from industrial emissions into high-value biomass.
The CO₂ gas used in the study was a simulated gas, with concentrations ranging from 10,000 to 30,000 ppm. To evaluate the CO₂ absorption kinetics, a Bubble Column Photobioreactor (BCBR) system with a design capacity of 8 L and a working volume of 5 L was designed and fabricated, ensuring optimal operating conditions for the growth of Spirulina platensis RIA2.
2.3. Prepare of the experiment
2.3.1. Experimental model
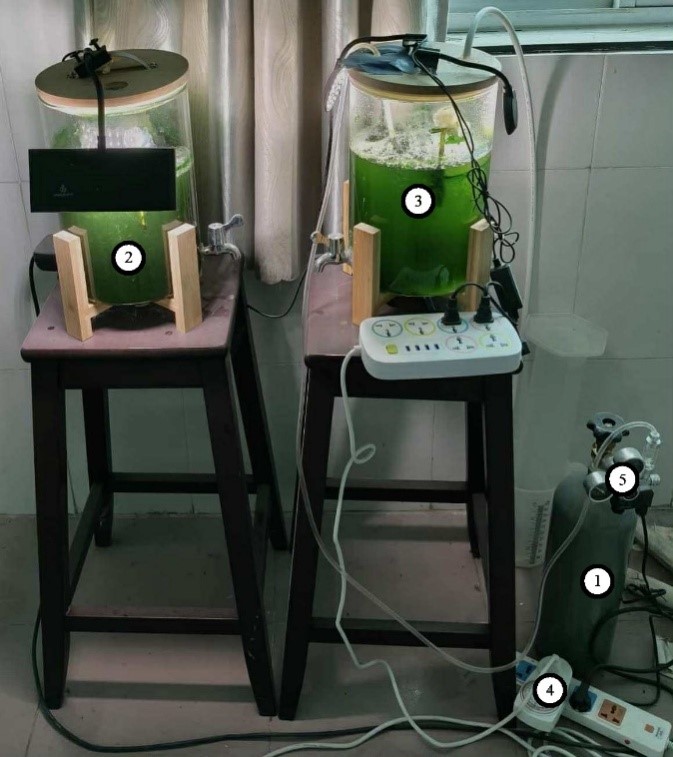
The study was conducted on 2 experimental models designed as Bubble Column Photobioreactor (BCBR) systems with a total capacity of 8 L, of which 5L is used as the working volume containing the Spirulina platensis RIA2 microalgae suspension. The tank is made of transparent glass, vertical cylinder, height 30 cm, convenient for observing and monitoring the growth of microalgae during the experiment. The model consists of the main parts: reaction column, air supply system, lighting system.
 |
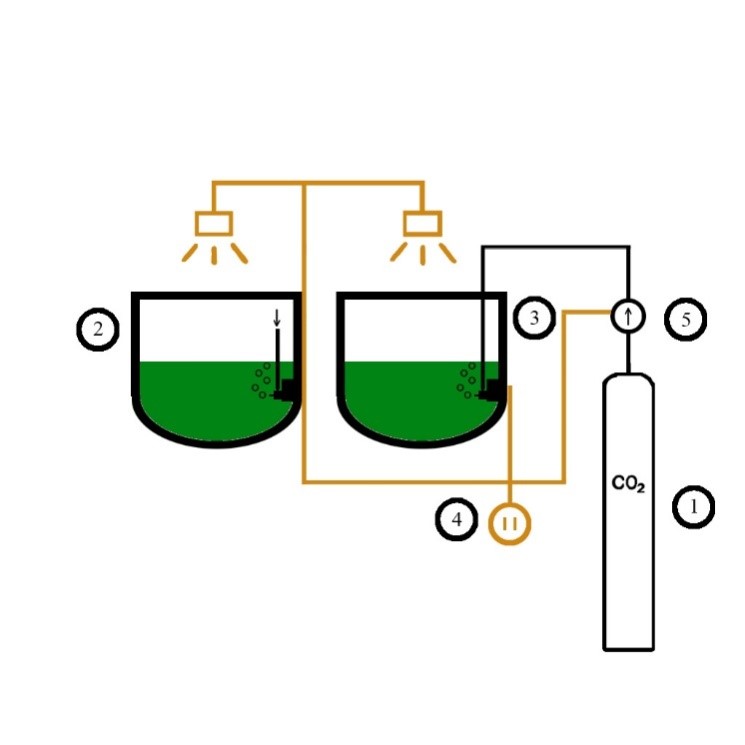 |
Figure 1. PhBR-B system with CO₂ source: 1- CO₂ tank, 2- The hermetic photobioreactor-biofilter (PhBR-B), 3- PhBR-B with CO₂ supply, 4-electrical systems, 5-one-way valve
Operating parameters such as temperature (30–35°C), light intensity (5000 lux), CO₂ concentration (10,000–30,000 ppm), and pH (9–11) were maintained stable throughout the experiment. The culture period was 21 days, during which the biomass was allowed to settle and samples were collected every 2 days at 10:00 a.m. to monitor growth rate and CO₂ uptake efficiency.
From the dimensions of the model, the tank characteristics are calculated as follows:
Cross-sectional area:

Tank diameter:

Liquid layer height:

Air clearance height: 
Illuminated surface area (lateral area):

Area/Volume Ratio (A/V):

Geometric ratio:

Effective optical path (light path): ≈ 18.4 cm
The above parameters show that the tank has a high area/volume ratio, which is favorable for light absorption and photosynthesis of microalgae; at the same time, the H/D ratio is reasonable, helping to increase the efficiency of gas dispersion and CO₂ absorption during the culture process.
2.3.2. Adaptation for Microalgae
Before the formal cultivation, the Spirulina platensis RIA2 strain underwent an acclimatization period to ensure stable growth under experimental conditions. This period lasted for 3 days in standard Zarrouk medium (Zarrouk, 1966), under continuous illumination of 4,000–5,000 lux and room temperature ranging from 30 - 35°C.
During the acclimation process, the pH was maintained in the range of 9.0–11.0. The biomass density was monitored daily by filtration and drying to constant mass, then converted to dry biomass concentration (g/L). When the biomass reached a stable value (~0.5 g/L), the inoculum was considered well acclimated and ready for formal experiment.
Before inoculation into the BCBR system, the algae samples were examined under a light microscope to identify the correct species of Spirulina platensis RIA2 as well as to assess the purity. Only samples that met the purity standards and had stable density were used for the main culture.
The initial inoculation ratio was set at 10% of the working volume, equivalent to 0.5 L of algal seed suspension for every 5 L of culture medium in the BCBR system.
Table 1. Nutritional composition of Zarrouk’s medium for cultivating Spirulina spp.
|
Ingredient |
Content |
|
NaCl |
1.00 g/L |
|
CaCl₂·2H₂O |
0.04 g/L |
|
NaNO₃ (KNO₃) |
2.50 g/L |
|
FeSO₄·7H₂O |
0.01 g/L |
|
EDTA (Na) |
0.08 g/L |
|
K₂SO₄ |
1.00 g/L |
|
MgSO₄·7H₂O |
0.20 g/L |
|
NaHCO₃ |
16.8 g/L |
|
K₂HPO₄ |
0.50 g/L |
|
Trace elements A₅: H₃BO₃, MnCl₂·4H₂O, |
|
|
ZnSO₄·4H₂O, NaMoO₄, CuSO₄·5H₂O |
1.00 mL |
Prior to inoculation into the system, the algal culture was examined under a microscope to confirm the species identity and assess purity.
2.4. Experimental procedure
The study was conducted in the following order:
Step 1: Prepare the experiment
Standard Zarrouk medium (Zarrouk, 1966) was prepared according to the composition in Table 1. The BCBR reactor (design capacity 8 L, working volume 5 L) was cleaned and sterilized with 70% alcohol, then rinsed several times with sterile distilled water. The lighting and aeration equipment were checked and calibrated before operation.
Step 2: Acclimatize the algae and perform preliminary trials
Spirulina platensis RIA2 strain was acclimatized for 3 days (light conditions 4,000–5,000 lux, room temperature 30–35 ° C , pH 9.0–11.0). Biomass density was monitored by filtration and drying. When the biomass reached a stable value (~0.5 g/L), the algae were checked for purity under a microscope and inoculated into the BCBR at an initial inoculation ratio of 10% of the working volume (0.5 L/5 L).
Step 3: Conduct the official experiment
The experiment was carried out in parallel on two BCBR systems with identical rearing conditions, differing only in the air supply: the first system (control) was aerated with normal air through an aerator placed at the bottom of the tank, while the second system (treatment) was aerated with compressed CO₂ (10,000–30,000 ppm) from an air tank through pipes and aerators. The experiment lasted 21 days. Samples were collected periodically every 2 days at the same time frame to ensure uniformity. The collected biomass was used to evaluate growth rate and performance CO₂ absorption efficiency.
2.5. Methods and analytical procedures
All chemicals used in this research were of analytical grade and imported from certified suppliers.Category chemical matter main serve service stool nitrate (NO₃⁻) and phosphate (PO₄³⁻) are released in the list of chemicals is presented in Table 3.
Table 3. List of chemicals used in the research
|
Chemicals name |
Chemical formula |
Country of origin |
|
2,6-Dimethyphenol |
C₈H₁₀O |
China |
|
Acetic acid (glacial) |
CH₃COOH |
China |
|
Sulfuric acid |
H₂SO₄ |
China |
|
Phosphoric acid |
H3PO4 |
China |
|
Aminosulfonic acid |
NH2SO3H |
China |
|
Glycerol |
HOCH₂CHOHCH₂OH |
China |
|
Tin(II) chloride dihydrate |
SnCl₂.2H₂O |
China |
Determination of microalgae biomass
Microalgal biomass was determined by thedry weight method. For each sampling, two replicate samples (25 mL/sample) were taken using a 25 mL volumetric flask, then filtered through a glass fiber filter paper with a known mass. The filter paper and biomass were dried at 105 °C to a constant mass. The biomass concentration (X, g/L) was calculated according to the formula (Tang et al., 2011):

In there is the mass of dry filter paper before filtration (g), is the mass of filter paper after drying with biomass (g), and V is the volume of filtered sample (L).
Determination of nitrate (NO₃⁻)
The NO₃⁻ concentration in the culture medium was determined by the colorimetric method using 2,6-dimethylphenol according to TCVN 6180:1996. After the reaction to form a yellow compound, the optical density of the solution was measured at a wavelength of λ = 342 nm using a UV-Vis spectrophotometer. The NO₃⁻ content was calculated based on the standard curve and expressed as mg/L.
Determination of phosphate (PO₄³⁻)
PO₄³⁻ content was analyzed according to TCVN 6202:2008, using the colorimetric method with ammonium molybdate and the reducing agent SnCl₂, forming a blue complex measured at a wavelength of λ = 690 nm. PO₄³⁻ concentration was determined from the standard curve and expressed in mg/L.
Determination of pH and temperature
The pH of the medium was determined directly using a standard pH paper (range 1–14). Temperature was monitored using a glass thermometer throughout the experiment.
Calculation of CO₂ fixation efficiency
The amount of CO₂ fixed by microalgae was estimated based on the dry biomass mass, assuming the biomass contained an average of 50% carbon by mass. The conversion formula (Tang et al., 2011):
CO2fixed (g/L) = X x1,88
Where X is the dry biomass concentration (g/L) and the factor 1.88 is the conversion factor from carbon content to equivalent CO₂ mass.
2.6. Data processing and analysis methods
All data obtained from the experiment were processed using Microsoft Excel 2019 software. The biomass index was sampled twice (n = 2), the results were expressed as mean ± standard deviation (mean ± SD) to reflect the experimental variability (Zar, 1999). For the NO₃⁻ and PO₄³⁻ indices, only one sample was analyzed at each collection, so the values were reported in single form (mg/L).
Specific growth rate (µ, day⁻¹) of Spirulina platensis RIA2 was determined by the biomass variation over the time interval [t_1,t_2] (Griffiths & Harrison, 2009):

In there and is the biomass concentration (g/L) at time point and .
CO₂ fixation capacity in biomass (Level A – biomass-equivalent).
As shown in the table, dry biomass is assumedto contain on average carbon by mass (Tang et al., 2011; Lim et al., 2021). From this, the conversion factor is determined:

Fixed CO₂ accumulated between two points in time ( g CO₂/L):

Average CO₂ fixation yield (g CO₂/L/day):

When system-scale conversion is required, the above value is multiplied by the working volume to express in g CO₂/day/device.
Net CO₂ equivalent (Level C – Net CO₂e). To reflect the system-wide carbon balance, net CO₂e is calculated using the formula (Lim et al., 2021; Wang et al., 2019):

In there:
 : CO₂ fixed in biomass (Level A).
Eelec: emissions from electricity consumption (kWh × grid emissions factor).
Echem : emissions from chemicals, including CO₂-eq equivalent from bicarbonate/carbonate salts (e.g. NaHCO₃: ).
Econs : emissions from consumables.
Etrans : emissions from transport.
Creditprod : product substitution credit when biomass is used as a substitute for another commercial product.
Statistical testing:The differences between the two systems (control - air aeration and treatment - CO₂ aeration) were analyzed using a two-sample independent t-test, with a significance level of p < 0.05 (Ruxton, 2006).
The results are illustrated with line graphs (showing trends in biomass, NO₃⁻,PO₄³⁻,and PCO₂over time) and bar graphs (comparing mean ± SD values between the two systems). In this study, CO₂ results are reported in parallel at both Level A (biomass-equivalent) and Level C (Net CO₂e), to reflect both biologically fixed CO₂ and net emissions of the entire system.
2.7. Analysis of equivalent CO2 absorption capacity
In this study, the equivalent CO₂ uptake capacity of Spirulina platensis RIA2 was evaluated based on two different calculation levels following the guidance of Lim et al. (2021):
Level A (biomass-equivalent): reflects the amount of CO₂ fixed in biomass through photosynthesis, calculated from the increase in dry mass. This is the most direct index to describe the biological performance of the system.
Level C (Net CO₂e): considers all life-cycle emissions and credits, including emissions from electricity, chemicals, consumables, transport, as well as credits when biomass replaces another commercial product. This indicator reflects the net emission reduction of the system, linked to the carbon credit development target.
The CO₂ results in the study are reported in parallel at both Level A and Level C , to both describe the CO₂ uptake capacity of microalgae at the experimental scale and to provide a basis for comparing potential applications to carbon markets.
3. RESULTS AND DISCUSSION
3.1. Biomass growth dynamics
Spirulina platensis RIA2 biomass monitoring in two systems (Air and CO₂) are shown in Figure 3.1. Both systems showed a strong growth trend in the first half of the experiment and a decline in the final stage, however the dynamics were clearly different.
CO₂ system (Figure 3.1b), biomass increased rapidly from 0.0099 g/25 mL (0.40 g/L) on day 1 to 0.0394 g/25 mL (1.58 g/L) on day 11, earlier than in Air, but then decreased to 0.0242 g/25 mL (0.97 g/L) on day 21.
Comparing growth coefficients showed that the CO₂ system peaked earlier (~3.98 times on day 11) but lower in absolute value, while the Air system peaked later (~3.20 times on day 16) and accumulated higher biomass. After the peak, biomass decreased more strongly in Air (53.3% decrease from day 16→21) than in CO₂ (38.6% decrease from day 11→21).
The specific growth rate (µ, day ⁻ ¹ ) calculated by the formula in Section 2.6 shows:
Analysis of the area under the biomass curve showed that the average biomass over 21 days in Air was ~1.96 g/L, which was approximately 2.04 times higher than that in CO₂ (~0.96 g/L). This demonstrates that the CO₂ system offers an advantage in growth rate and early peaking, while the Air system maintains a stable biomass and accumulates more in the long term.
The above results are consistent with the trend reported in previous studies (Singh & Dhar, 2011; Ho et al., 2017), suggesting that CO₂ supplementation increases initial growth rates but requires nutrient and pH management to maintain the effect over the long term.
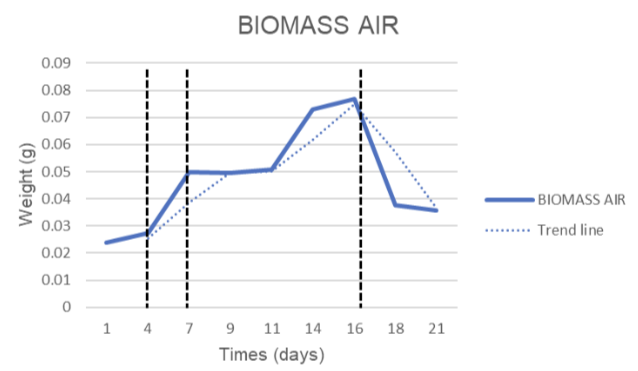
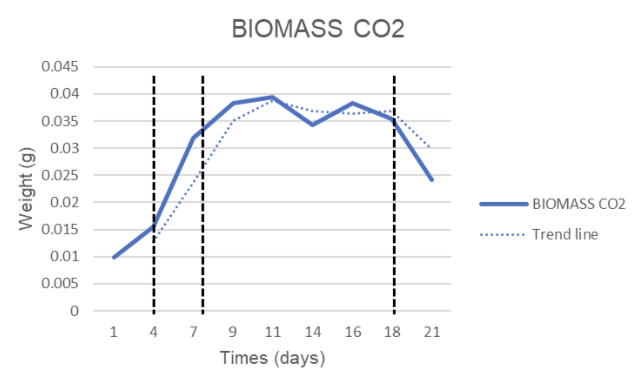
Figure 3.1. Spirulina platensis RIA2 biomass dynamics during 21 days of culture: (a) Air system and (b) CO₂ system. Solid lines show experimental values, dashed lines show trend lines; vertical bars indicate main observation periods.
CO₂ fixed efficiency
The CO₂ fixation capacity of Spirulina platensis RIA2 was calculated using the biomass-equivalent method (Level A), with a conversion factor of 1.83 g CO₂/g DW (Tang et al., 2011). The results showed that the two systems Air and CO₂ had clear differences in dynamics and total amount of CO₂ fixed during the 21-day experiment.
Fixed CO₂ Productivity Value (PCO₂)The highest PCO₂ was recorded at the 4–7 day period. The Air system reached a peak of 0.551 g CO₂·L⁻¹·day⁻¹, which was higher than the CO₂ system (0.395 g CO₂·L⁻¹·day⁻¹). However, the CO₂ system had a cycle-averaged PCO₂ of 0.052 g CO₂·L⁻¹·day⁻¹, which was slightly higher than the Air system (0.043 g CO₂·L⁻¹·day⁻¹), reflecting the short-term growth advantage of the CO₂ system.
Figure 3.2 shows that the PCO₂ of the CO₂ system increased sharply in the early stages but decreased rapidly after day 11, even showing negative values reflecting biomass decomposition. In contrast, the Air system maintained a more stable PCO₂ until day 16 before decreasing. This result is consistent with the biomass dynamics (Figure 3.1), demonstrating that CO₂ supplementation accelerates growth but is difficult to maintain in the long term without balancing nutrients and pH.
Table 3.2. CO₂ fixation efficiency (Level A) of Spirulina platensis RIA2 in two Air and CO₂ systems
|
System |
Peak CO₂ (g CO₂·L⁻¹·day⁻¹) |
Average PCO₂ (g CO₂·L⁻¹·day⁻¹) |
Net CO₂ (g CO₂/L, 21 days)
|
Net CO₂/device (g, 5 L) |
|
Air |
0.551 |
0.043 |
0.864 |
4.32 |
|
CO2 |
0.395 |
0.052 |
1,047 |
4.32 |
Figure 3.2. Dynamics of CO₂ fixation productivity (PCO₂, g CO₂·L⁻¹·day⁻¹) of Spirulina platensis RIA2 in two Air and CO₂ systems. Values are calculated according to Level A from the variation of biomass concentration, with a conversion factor of 1.83 g CO₂/g DW.
The CO₂ system has the advantage of speed and total CO₂ fixation, while the Air system remains more stable and sustainable. This result emphasizes that CO₂ supplementation is only effective when accompanied by strict management of nutrients and operating conditions, otherwise it will lead to C/N imbalance and biomass loss in the late stage.
3.2. Fluctuations in NO₃⁻ and PO₄³⁻ concentrations
The variation of inorganic nutrient concentrations is shown in Figure 3.3 (NO₃⁻) and Figure 3.4 (PO₄³⁻). Both systems show a decreasing trend over time, however the consumption rates are significantly different between Air and CO₂.
In the Air system, NO₃⁻ concentration decreased from 4.40 mg/L (day 1) to 0.49 mg/L (day 21), corresponding to 88.9% consumption. Meanwhile, in the CO₂ system, NO₃⁻ decreased from 4.97 mg/L to 2.26 mg/L after 21 days, a consumption of only 54.5%. This shows that the Air system used nitrate almost completely, while the CO₂ system still had a significant nitrate residue at the end of the period. This trend is consistent with the biomass dynamics: the Air system maintained stable growth thanks to the efficient use of nitrate sources, while the CO₂ system, although growing rapidly at the beginning of the period, could not utilize nitrate in the long term due to the C/N imbalance.
PO₄³⁻ concentrations decreased slightly in both systems. In the Air system, PO₄³⁻ decreased from 0.0115 mg/L to 0.00836 mg/L (a decrease of 27.2%). Meanwhile, in the CO₂ system, it decreased from 0.0123 mg/L to 0.00737 mg/L (a decrease of 39.9%). Thus, the phosphate consumption between the two systems was not significantly different and was not the decisive factor for the difference in growth dynamics between Air and CO₂.
The above results show that nitrate (NO₃⁻) is the main limiting nutrient, determining the ability to maintain growth and fix CO₂. The Air system with the ability to fully utilize nitrate achieved an average biomass and a more stable CO₂ fixation ability. In contrast, the CO₂ system, although having an abundant carbon source, due to the incomplete utilization of nitrate, growth was concentrated in the early stage and declined rapidly in the late stage. Phosphate (PO₄³⁻) decreased at a similar rate in both systems, so it had little effect on the overall difference.
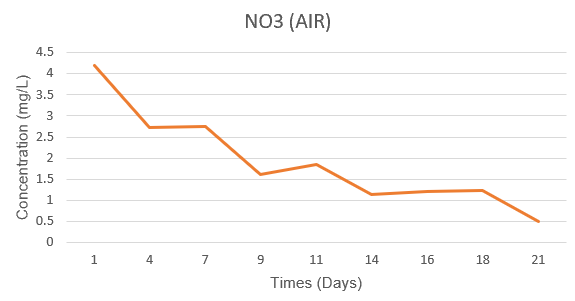
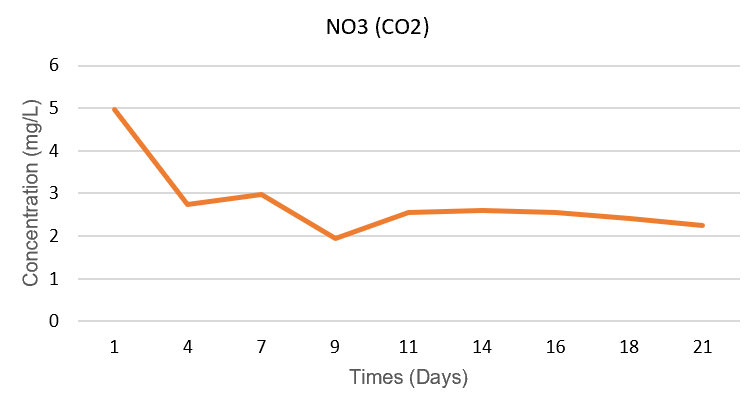
Figure 3.3. Changes in NO₃⁻ concentration (mg/L) of Spirulina platensis RIA2 in two Air and CO₂ systems over culture time.
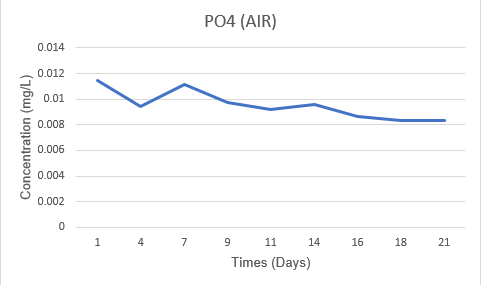
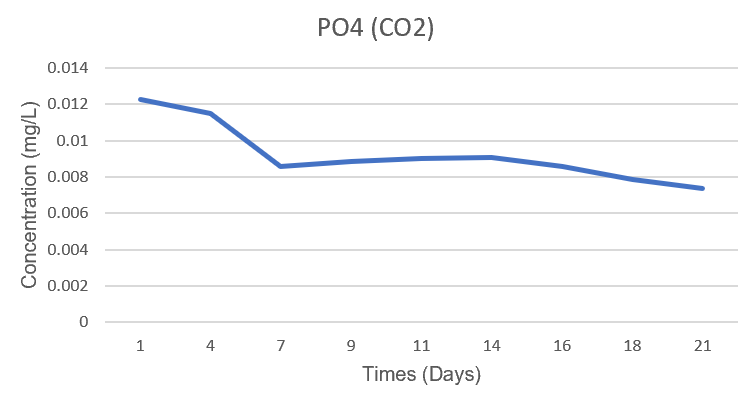
Figure 3.4. Changes in PO₄³⁻ concentration (mg/L) of Spirulina platensis RIA2 in two Air and CO₂ systems over culture time.
3.3. Relationship between nutrient consumption and CO₂ fixation capacity
The changes in inorganic nutrients in the culture medium were closely related to the biomass dynamics and CO₂ fixation efficiency (PCO₂) of Spirulina platensis RIA2. The experimental results showed that nitrate (NO₃⁻) was the main limiting nutrient, while phosphate (PO₄³⁻) did not make a significant difference between the two systems.
In the Air system, the sharp decrease in NO₃⁻ from 4.40 to 0.49 mg/L (88.9% reduction) was accompanied by a steady increase in biomass, reaching a plateau by day 16. This also reflected a more sustained CO₂ uptake efficiency, with PCO₂ remaining positive until day 16 before declining. In contrast, in the CO₂ system, despite a high initial growth rate ( = 0.237 day⁻¹, maximum PCO₂ of 0.395 g CO₂·L⁻¹·day⁻¹ on days 4–7), NO₃⁻ concentrations remained relatively high at the end of the cycle (2.26 mg/L). This suggests that the abundant carbon source was not sufficient to sustain biomass accumulation if nitrate was not fully utilized, resulting in a decline in PCO₂ after day 11.
PO₄³⁻ consumption was relatively uniform in both systems (27.2% reduction in Air and 39.9% in CO₂), with no clear correlation to the differences in biomass and CO₂ fixation. Thus, phosphate was not the main limiting factor under these experimental conditions.
In summary, the relationship between nutrition and CO₂ fixation capacity is shown in:
These results confirm the importance of carbon and nitrogen synchronization strategies in photobioreactor system design, and suggest directions for optimizing nutrient combinations to enhance CO₂ uptake efficiency and reduce net emissions at industrial scale.
3.4. Summary and outlook
The experimental results showed that the growth dynamics and CO₂ uptake capacity of Spirulina platensis RIA2 were strongly dependent on the culture conditions. The CO₂ system provided high growth rates and carbon fixation in the early stages, but was unstable in the long term due to C/N imbalance. In contrast, the Air system maintained a moderate biomass and higher CO₂ uptake efficiency throughout the entire cycle, thanks to its ability to fully utilize nitrate.
These results are consistent with previous studies (Tang et al., 2011; Singh & Dhar, 2011; Ho et al., 2017), confirming that CO₂ addition is only effective when accompanied by nutrient and pH management. This has important implications for the operation of industrial-scale microalgae cultivation systems, where the costs of aeration and pH adjustment can significantly increase indirect emissions.
At Level A (biomass-equivalent), the CO₂ system had a higher total net CO₂ fixation (1.047 g/L) than the Air system (0.864 g/L). However, when scaling up to Level C (Net CO₂e), indirect emissions from electricity (aeration, lighting) and chemical addition need to be taken into account. Recent studies (Lim et al., 2021; Wang et al., 2019) show that electricity consumption is often the largest source of emissions in closed microalgae systems. This means that although the CO₂ system has a speed advantage, it may not necessarily result in a higher net emission reduction than the Air system, especially under experimental conditions with continuous electricity consumption.
Application prospects.
Scientifically: This result provides evidence that the optimal combination of carbon and nitrogen is key to enhancing biological CO₂ fixation efficiency.
In terms of technology: To achieve a positive net efficiency (Net CO₂e), improvements are needed in two main directions: (i) reducing energy consumption (optimizing aeration, using high-performance LEDs or natural light sources), and (ii) taking advantage of reusable nutrient sources, for example, nitrate/phosphate-rich wastewater from the food industry.
Economic and environmental: This result can be used as a basis for building a biocarbon credit model. In an industrial-scale scenario, the amount of CO₂ fixed by microalgae can be converted into carbon credits, contributing to the reduction of greenhouse gas emissions and bringing additional economic value to the energy and food processing industries.
CO₂ addition offers a speed advantage but does not guarantee sustainability, while airs systems are slower but more stable and efficient in the long term. When integrated into a life cycle analysis (Level C), Air systems can provide better Net CO₂e performance. This highlights the need for microalgae systems targeting carbon credits to be designed to optimize carbon, nutrients and operating energy simultaneously.
4. CONCLUSION
4.1. Conclusion
The study demonstrated the feasibility of a CO₂ capture model based on the microalga Spirulina platensis RIA2 with two different culture systems. The results showed that the CO₂ system had a fast growth rate in the early stages, with a doubling time of only 2.92 days, but the maximum biomass was lower and declined earlier than the Air system. In contrast, the Air system, although growing slower, reached the highest maximum biomass (3.064 g/L on day 16) and maintained an average biomass throughout the cycle that was almost twice as high as the CO₂ system, reflecting superior long-term sustainability. The CO₂ fixation efficiency calculated at Level A showed that the CO₂ system captured a total of 1.047 g CO₂/L (5.23 g/device), approximately 21% higher than the Air system (0.864 g CO₂/L; 4.32 g/device). However, the Air system achieved a higher peak PCO₂ yield and maintained a positive value for longer. In addition, nutrient analysis showed that nitrate was the main limiting factor, with a consumption of 88.9% in the Air system compared to 54.5% in the CO₂ system, while phosphate decreased similarly in both systems and had little effect on the growth dynamics differences. In terms of Net CO₂e, the Air system has the potential to deliver higher net emission reductions due to the full nitrate utilization and stable biomass maintenance.
4.2. Recommendations
Based on the results obtained, the study recommends that larger-scale and longer-duration trials be conducted to verify the system’s stability, and that the assessment be extended to Level B and Level C to more accurately quantify the net emission reduction. Optimization of operating conditions, including light, pH, aeration rate, and initial density, is necessary to improve both the growth rate and sustainability of CO₂ fixation. In terms of applications, the microalgae model can be directly integrated with CO₂-rich sources such as thermal power plants or the food processing industry, combining the use of recycled nutrients from nitrogen- and phosphorus-rich wastewater to reduce costs and increase sustainability. At the same time, indirect emission reduction through energy optimization and the application of renewable energy sources will contribute to improving the Net CO₂e balance. In terms of economic and environmental aspects, the study proposes the development of a life cycle database to serve as a basis for biocarbon credit valuation, and the linkage of microalgae biomass production with value-added products to improve economic efficiency. These orientations will help the microalgae model become a potential solution in the strategy of reducing greenhouse gas emissions and developing a green economy.
Regarding application prospects, it is necessary to propose the possibility of using renewable energy sources such as solar power and wind power to operate pumping, aeration, lighting systems, etc. in the environmental treatment and management process. Integrating these clean energy sources will help improve operating efficiency, reduce energy costs and increase autonomy in operations. At the same time, the use of renewable energy also plays an important role in reducing greenhouse gas emissions, ensuring sustainability throughout the entire life cycle of the system. This is a direction in line with the green development trend, friendly to the environment and meets the criteria for minimizing negative impacts on the global climate.
Aeration systems consume a lot of electricity, especially in shrimp farms or wastewater treatment. Using solar or wind power helps reduce operating costs, increase equipment durability and almost eliminate CO₂ emissions. In the Southwest region, many farms have applied solar power systems to operate oxygen pumps, maintaining stable oxygen levels without the need for diesel generators. In the field of urban lighting, LED projects combined with solar panels in Hanoi are proving to be clearly effective: saving electricity, operating independently and reducing pressure on the grid. When considering the whole life cycle, these systems have a long life, low maintenance costs and almost no emissions, superior to traditional solutions.
Despite the great potential, the deployment of renewable energy still faces many challenges: the instability of energy sources, high initial investment costs and complex technical requirements. To overcome this, there needs to be supportive policies from the government, development of electricity storage technology and training of specialized human resources. Coordination between the government, businesses and the community is the key to promoting this transition. In the context of Vietnam moving towards green development goals, applying renewable energy to aeration and lighting systems is not only an inevitable trend but also a driving force for a sustainable future.
Acknowledgement: This research was funded by Ho Chi Minh City University of Technology, Vietnam National University under project number of SVOISPL-2024-MT&TN – 50.
Võ Xuân Hải1,2, Lê Uyển Nhi1,2, Vũ Văn Nam3, Đặng Vũ Bích Hạnh1,2,*
1 Ho Chi Minh City University of Technology (HCMUT)
2 Vietnam National University Ho Chi Minh City
3Coolimpact, No. 53, M4 Street, The Manhattan, Vinhomes Grand Park, Ho Chi Minh City
(Source: The article was published on the Environment Magazine by English No. III/2025)
REFERENCES
[1] D. Y. Y. Tang, W. Han, P. Li, X. Miao, and J. J. Zhong, “CO₂ biofixation and fatty acid composition of and in response to different CO₂ levels,” , vol. 102, no. 3, pp. 3071–3076, 2011.
[2] S. P. Singh and D. W. Dhar, “Microalgae as second generation biofuel: A review,” , vol. 31, pp. 605–629, 2011.
[3] S. H. Ho, C. Y. Chen, and J. S. Chang, “Effect of light and CO₂ supply on biomass and lipid productivity of ,” , vol. 113, pp. 244–252, 2017.
[4] J. Lim, Y. Lee, and H. Lee, “Life cycle assessment of carbon capture and utilization in microalgae systems: Implications for carbon credit and sustainable development,” , vol. 290, p. 125186, 2021.
[5] H. Wang, W. Zhang, L. Chen, J. Wang, and T. Liu, “The shift of lipid metabolism in microalgae under light/dark cycles for biofuel production,” , vol. 289, p. 121631, 2019.
[6] G. D. Ruxton, “The unequal variance t-test is an underused alternative to Student’s t-test and the Mann–Whitney U test,” , vol. 17, no. 4, pp. 688–690, 2006.
[7] C. Zarrouk, “Contribution à l’étude d’une cyanophycée : Influence de divers facteurs physiques et chimiques sur la croissance et la photosynthèse,” PhD Thesis, Université de Paris, 1966.
[8] TCVN 6180:1996, .
[9] TCVN 6202:2008, .
[10] N. Politaeva, I. Ilin, K. Velmozhina, and P. Shinkevich, “Carbon Dioxide Utilization Using Microalgae,” , vol. 10, no. 7, p. 109, 2023.
[11] Nguyễn Văn A. et al., “Ứng dụng vi tảo trong hấp thu CO₂ từ khí thải công nghiệp,” , vol. 4983, pp. 1–10, 2023.
[12] T. C. Assis, M. L. Calijuri, P. P. Assemany, A. S. A. P. Pereira, and M. A. Martins, “Using atmospheric emissions as CO₂ source in the cultivation of microalgae: Productivity and economic viability,” , vol. 215, pp. 1160–1169, 2019.
[13] E. Daneshvar, R. J. Wicker, P. L. Show, and A. Bhatnagar, “Biologically-mediated carbon capture and utilization by microalgae,” , vol. 427, p. 130884, 2022.
[14] B. Wang, Y. Li, N. Wu, and C. Q. Lan, “CO₂ bio-mitigation using microalgae,” , vol. 79, pp. 707–718, 2008.
[15] S. A. Razzak, M. M. Hossain, R. A. Lucky, A. S. Bassi, and H. I. de Lasa, “Integrated CO₂ capture, wastewater treatment and biofuel production by microalgae,” , vol. 27, pp. 622–653, 2013.
[16] M. K. Lam, K. T. Lee, and A. R. Mohamed, “Current status and challenges on microalgae-based carbon capture,” , vol. 10, pp. 456–469, 2012.
[17] D. M. Thomas, J. Mechery, and S. V. Paulose, “Carbon dioxide capture strategies from flue gas using microalgae: A review,” , vol. 23, pp. 16926–16940, 2016.
[18] U. B. Singh and A. S. Ahluwalia, “Microalgae: A promising tool for carbon sequestration,” , vol. 18, pp. 73–95, 2013.
[19] R. Prasad, S. K. Gupta, N. Shabnam, C. Y. B. Oliveira, A. K. Nema, F. A. Ansari, and F. Bux, “Role of microalgae in global CO₂ sequestration: Mechanisms, challenges and future prospects,” , vol. 13, no. 23, p. 13061, 2021.
[20] B. Barati, K. Zeng, J. Baeyens, S. Wang, M. Addy, S. Y. Gan, and A. E. Abomohra, “Recent progress in genetically modified microalgae for enhanced CO₂ sequestration,” , vol. 145, p. 105927, 2021.
[21] J. Li, K. Pan, X. Tang, Y. Li, B. Zhu, and Y. Zhao, “Molecular mechanisms of sp. responding to high CO₂: Comparative transcriptome analysis,” , vol. 763, p. 144185, 2021.
[22] R. Chauvy, N. Meunier, D. Thomas, and G. De Weireld, “Selecting emerging CO₂ utilization products for short- to mid-term deployment,” , vol. 236, pp. 662–680, 2019.
[23] Tripathi S, Choudhary S, Meena A, Poluri KM, “Carbon capture, storage and usage with microalgae: a review,” Environmental Chemistry Letters, vol. 21, pp. 2085–2128, 2023.
[24] United Nations Framework Convention on Climate Change (UNFCCC), “Viet Nam – High-level segment statement, COP26, Glasgow,” 2021.
[25] United Nations Framework Convention on Climate Change (UNFCCC), “Viet Nam – Updated Nationally Determined Contribution (NDC),” 2022.
[26] Vonshak A, Tomaselli L, “Arthrospira (Spirulina),” in Handbook of Microalgal Culture: Applied Phycology and Biotechnology, 2nd ed., A. Richmond and Q. Hu, Eds. Oxford: Wiley-Blackwell, 2013.
[27] Delrue F, Alaux E, Moudjaoui L, Gaignard C, Fleuret JP, Godon P, et al., “Optimization of Arthrospira platensis (Spirulina) growth: from laboratory scale to pilot scale,” Fermentation, vol. 3, no. 4, p. 59, 2017.
[28] Dębowski M, Zieliński M, Vdovychenko A, Kazimierowicz J, “The use of the autotrophic culture of Arthrospira platensis for CO₂ fixation from biogas combustion,” Processes, vol. 12, no. 2, p. 396, 2024.
[29] Petrova O, et al., “Direct study of CO₂ capture efficiency during Arthrospira platensis cultivation at high CO₂ concentrations,” Plants, vol. 12, no. 13, p. 2470, 2023.
[30] Zhao S, Feng W, Li J, Zhang X, Liu L, Li H, “Effects of bubble-cutting dynamics on microalgal growth in a bubble-column photobioreactor with a novel aeration device,” Frontiers in Bioengineering and Biotechnology, vol. 11, p. 1225187, 2023.