
29/07/2024
Abstract
The section of Dao river that flows through Nam Dinh city plays a very important role in the socio–economic development of Nam Dinh province. The water of this section also serves as raw water input for Nam Dinh Water Plant which supplies clean water for domestic and industrial use in Nam Dinh city. Therefore, the management and protection of the water quality is of great significance. The study develops artificial intelligence (AI) model to simulate the water quality of Dao river, based on the results of hydrodynamic simulation and water quality in the hydraulic model MIKE11. This study applies hydrodynamic modeling method (MIKE11) and artificial intelligence (AI) model to evaluate water quality of Dao river. The results of this study show that the method of using the MIKE 11 model combined with the AI model to simulate river water quality is relatively accurate. The results show that the wastewater treatment plant on the Dao river is generally still in good condition and has the ability to receive additional waste sources if the waste sources are treated before being discharged into the environment.
Key words: water resource management; urban water supply; Dao river, MIKE model, water quality, Artificial Intelligence model; MLP-ANN.
JEL Classifications: O13, Q53, R11
Received: 28/3/2024; Revised: 8/4/2024; Accepted: 20/6/2024.
1. Introduction
Dao river is a distributary of the Red River and a tributary of the Day river, flowing in Nam Dinh province, starting from the Red River and sending part of the water flowing in the South direction (the boundary between Nam Dinh city, the districts: My Loc, Vu Ban, Y Yen, Nam Truc, Nghia Hung), then flows into the Day river and flows into the East Sea. The total length of the river is 33.5 km (Figure 1). (Xuân, T.T, 2012). As a source of clean water for the majority of residents in Nam Dinh city, Dao river is also an area that receives domestic and industrial wastewater from the city's river/drainage canal system through three main outlets: the pumping station Quan Chuot, Kenh Gia pumping station and Coc Thanh pumping station. Currently, due to water flowing from the Red River and pressure from wastewater sources that have not been thoroughly treated, the Dao river water source is at risk of being polluted, affecting the water supply safety of Nam Dinh city, therefore protecting water quality and providing control solutions to protect Dao river's water quality is a very urgent issue.
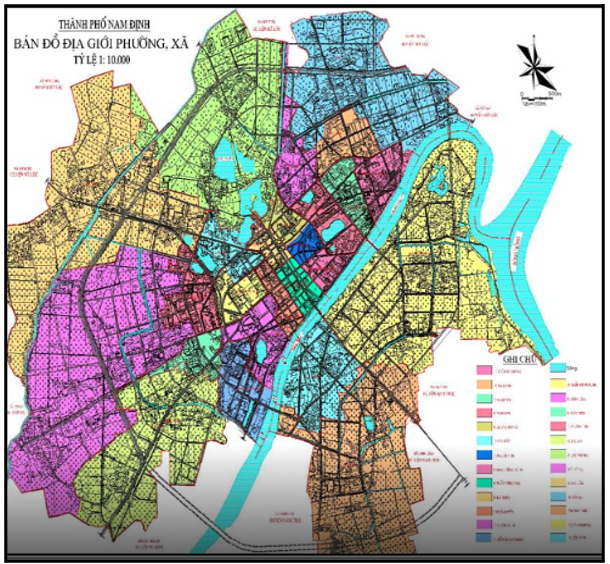
Figure 1. Map of Dao river flowing through Nam Dinh city
Calculating and simulating spatial and temporal variations of pollutants plays an important role in assessing and controlling water quality. With the development of information technology as well as water quality modeling, more and more water quality simulation models are born and developed. Some popular mathematical models that have been developed include QUAL, WASP, QUASAR, MIKE Ecolab. These models belong to the group of numerical models, which model the water spreading process on river and canal systems. The advantage of this group of models is that it can provide information to assess water quality over space and time. However, setting up the model is relatively complicated and takes a lot of time, requiring model users to have specialized knowledge in calibrating, testing and evaluating model results. Especially, in developing countries like Vietnam, due to the complexity in setting up the model, it will be very difficult to transfer the model to local management agencies for use. Therefore, developing simple, accessible and easy-to-use models is an urgent requirement.
Recently, AI models for water quality prediction simulation have been widely applied due to their fast calculation ability with high reliability and efficiency. Besides, hydrological processes are generally non-linear processes in nature, changing over space and time such as flow and water quality. Therefore, the description of the above processes and factors needs to be analyzed non-linearly. When the data is large enough, along with the algorithm and coefficients of the AI model set appropriately, the model is capable of simulating factors with high performance and accuracy, and can replace Numerical hydraulic model.
Reality shows that AI models have outstanding advantages and are suitable in managing, evaluating, simulating, and predicting effective water quality in a number of countries around the world. However, the approach of using AI technology to simulate water quality is still one of the relatively new research directions in the world today. In Vietnam, so far there have not been many studies evaluating water quality simulation using AI networks. One of the reasons why AI models have not been widely used is due to the lack of data to process and then make predictions with the most optimal accuracy for AI models. Compared to numerical models, AI technology does not require users to have in-depth professional knowledge because the analysis and data processing tasks are hidden behind the scenes. The technology also provides quick calculation results, suitable for simulation, water quality prediction as well as decision support in pollution control. Therefore, the research will combine both the MIKE11 model and the AI model to increase the reliability of the AI model, in which the MIKE11 model is used to create a database under different scenarios along with data. Measurement data is available as input to the AI model. This article presents some results from the method of using the MIKE 11 model combined with an AI model to simulate water quality for Dao river in Nam Dinh province.
2. Methodology
The study uses a combination of MIKE11 models (DHI. MIKE11, 2017) and AI models (Ighalo, J.O et al 2021) in computational simulation of Dao river water quality. In particular, the mathematical modeling method uses one-dimensional MIKE HD, AD and Ecolab models to simulate water quality developments and create an input database for the AI model. Research using the MIKE model to simulate hydraulics and water quality in the river basin with data series from 2016-2020 in daily steps to calibrate and verify the model, then simulate quality results. Water is used as input data for the AI model. The AI model uses AI algorithms to build regression relationships between water quality at a number of control locations and variables that affect quality at these control locations (river water flow, concentration of pollutants, pollutants and flow at waste sources). Figure 2 presents the connection diagram between the hydraulic model, water quality model and AI model used in this study.
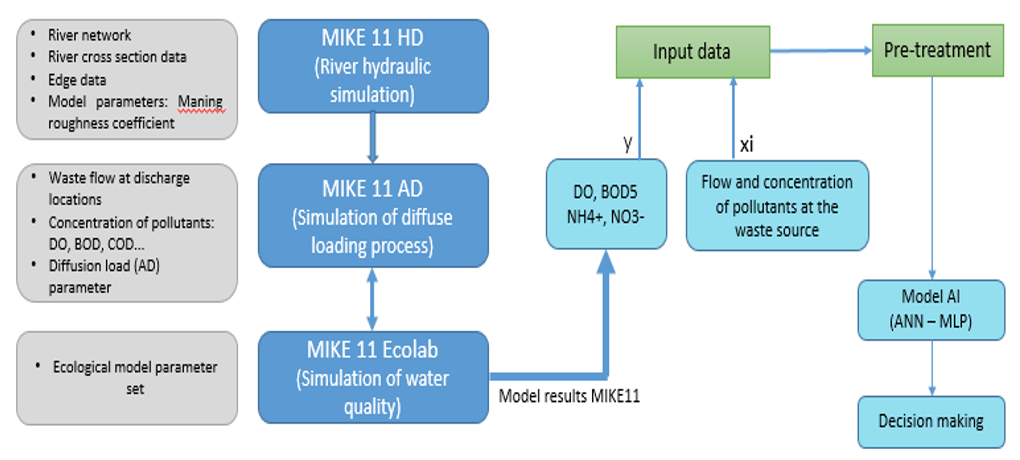
Figure 2. Research method diagram
MIKE11 is a one-dimensional hydrodynamic model for simulating irregular flows in rivers and open channels. MIKE11 was developed by the Danish Hydraulics Institute, in which the hydrodynamics (HD) module using flow calculation is the main module.
The basic characteristic of the MIKE11 Model system is a comprehensive module structure with many types of modules added to each simulation of phenomena related to the river system. In addition to the hydrodynamics (HD) module, MIKE includes other modules such as:
- Hydrology module (NAM) uses data interpolation;
- The substance spread module (AD) uses the properties of substance spread (saltiness, suspension or decomposition in open channels...) to simulate the diffusion loading process of those compounds;
- Ecological module (Ecolab) simulates biological transformation processes of compounds in rivers. This module must be accompanied by the loading - diffusion (AD) module. Diffusion (AD) is used to simulate the diffusive transport of such compounds.
Hydrodynamic module (HD)
To calculate the flow in the river channel, the MIKE11 model uses the one-dimensional Saint Venant equation system (momentum and substance conservation equations) and applies the 6-point alternating difference scheme Q,H of Abbott, and Ionescu. (Chau, K.W,2006):
Continuous equation:
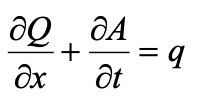 (1)
(1)
The momentum equation:
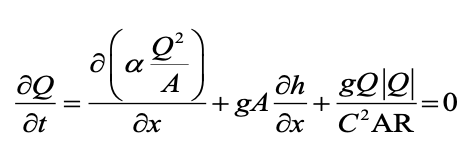 (2)
(2)
In which: Q- Flow rate (m3/s); A- Cross-sectional area (m2); q- Influent flow per unit length along the river (m2/s); C- Chezy coefficient; α- Momentum correction coefficient; R- Hydraulic radius (m).
Agent spreading module (AD)
The AD module is based on the solute conservation equation [5,6]:
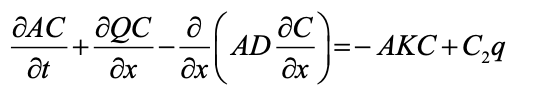 (3)
(3)
In which: A: Cross-sectional area (m2); C: Concentration (kg/m3); D: Dispersion coefficient; q: Influent flow per unit length along the river (m3/s); K: Biodegradation coefficient (K is only constructed when the phenomena or processes considered are related to biochemical reactions).
Ecolab ecological module
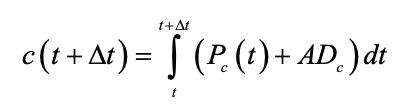
The dynamics of the advection of state variables in ECO Lab can be described by the transport equations of non-conservative matter, of the form (4):
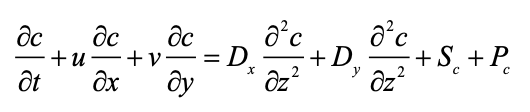 (4)
(4)
In there:
- c: Concentration of ECO Lab state variable;
- u, v: Flow velocity components;
- Dx, Dy: Diffusion coefficients in x and y directions;
- Sc: The source of birth and the source of loss;
- Pc: Processes in ECOLab;
The transport equation can be rewritten as follows:
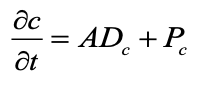 (5)
(5)
In particular, the ADc group represents the rate of change in concentration caused by advection and diffusion processes (including sources of generation and loss).
When calculating the concentration variations for the next step, a numerical ECOLab equation is substituted for the time-integral transport equations. Another approximation method used in ECOLab is to consider the advection–advection component ADc as constant over a time step. Solving both components of ECOLab's ordinary difference equation is a combination of the rate of change caused by internal processes and advection-diffusion processes (6).
 (6)
(6)
The advective-diffusive component is approximated by the following formula:
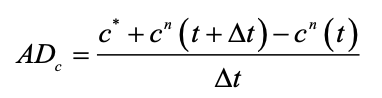 (7)
(7)
In which: the instantaneous concentration c* is given by the state variable transmission process in ECOLab when matter is conserved throughout the cycle of using the AD module.
The river network diagram simulating water quality developments on the Dao river system is presented in Figure 3. Inputs for the HD hydraulic modules, AD diffuse load and Ecolab of the MIKE 11 numerical model include: network river, river profile data, boundary data, roughness coefficient parameters (MIKE11 HD); flow rate, concentration of pollutants and source location, parameter sets of diffuse (MIKE11 AD) and ecological (MIKE11 Ecolab) loading modules. Simulated water quality factors include BOD5, NH4 -N, NO3-N, DO and temperature.
Upper boundary (flow boundary or water level) is the actual flow or water level measured at the upper nodes of the calculation diagram.
The lower boundary (water level boundary) is the actual measured or calculated water level at the lower nodes of the calculation diagram, usually tide level stations. Boundary types and calculation and simulation diagrams are shown in Table 1, Figure 2.
Table 1. Boundary conditions in Hydraulic Models MIKE 11
|
No |
Station, location |
River branches |
Boundary type |
Boundary form |
|---|---|---|---|---|
|
1 |
Hung Yen |
Hong |
H~t |
Upper boundary |
|
2 |
Phu Ly |
Day |
H~t |
(Actual measured) |
|
3 |
Gian Khau |
Hoang Long |
H~t |
|
|
4 |
Ba Lat |
Hong |
H~t |
Lower boundary (Actual measured) |
|
5 |
Phu Le |
Ninh Co |
H~t |
|
|
6 |
Nhu Tan |
Day |
H~t |
|
|
7 |
Nam Dinh |
Dao |
Q~t |
Calibration and verification |
Table 2. List of Dao river water quality boundaries in the MIKE11 Model
|
No |
Observation location |
Section location in the MIKE11 model |
Boundary form |
|
1 |
SDO1 |
500 |
Calibrate, water quality testing |
|
2 |
SDO2 |
7089 |
|
|
3 |
SDO3 |
9913 |
|
|
4 |
SDO4 |
13079 |
|
|
5 |
SDO5 |
21723 |
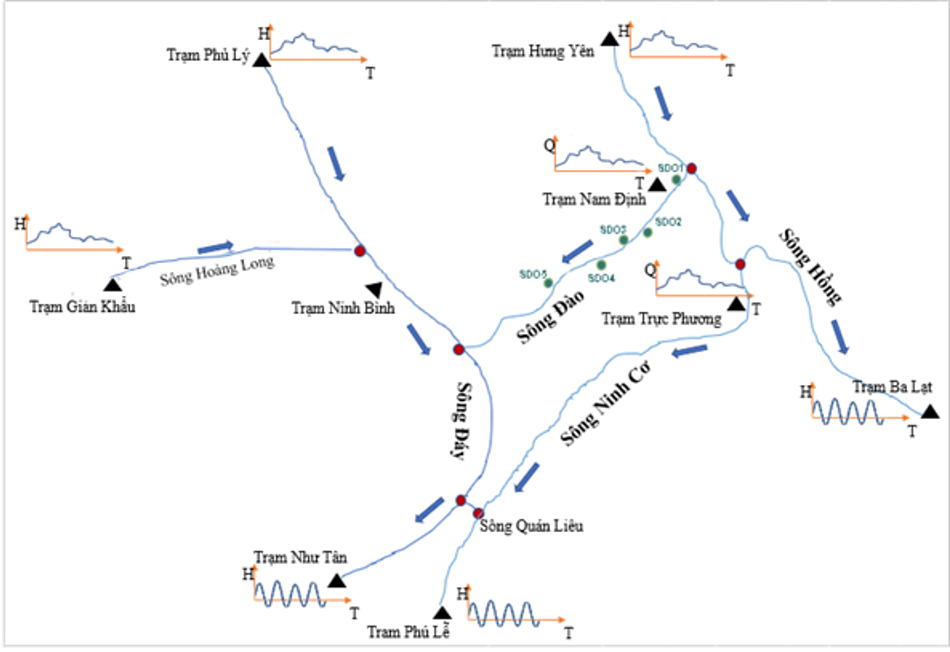
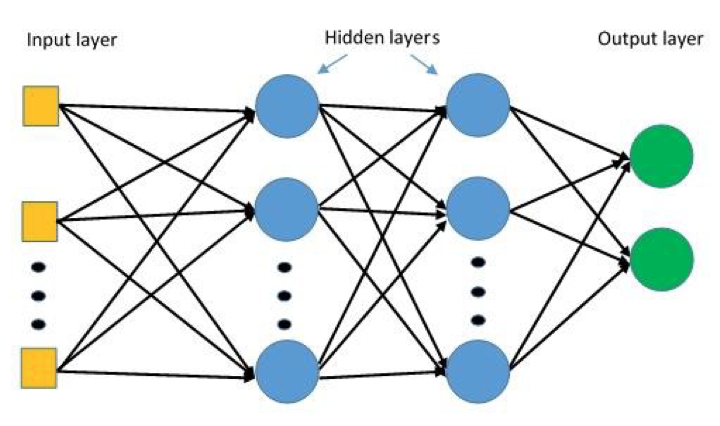
Figure 4. Illustration of Multilayer Perceptron (ANN-MLP) regression network: Input layer, Output layer and Hidden layers
Models are built from AI algorithms by processing data to make predictions. The process of processing data in the model is to determine parameters, which are closely related to the data including in the model. Meanwhile, the validation process will evaluate the reliability of the model. Algorithms are selected in each respective model to find the model suitable for the research. Select the appropriate optimization method in the model with the purpose of increasing the accuracy of the model. The parameters in the model will be determined by calculation and trial and error. Adjust the model parameters for the area so that the calculated results match the actual measured data. Use the correlation coefficient (R2) to evaluate the effectiveness of the AI Model compared to the results from the MIKE 11 Model. This index reflects the level of explanation of the independent variables for the dependent variable in the regression model regulation (Chena, Y.H; Chang, F.J, 2009).
Model data includes processing and testing data, divided at a rate of 90% data used for processing, 10% data used for testing. Before being fed into the AI model to process and make predictions, the data set will be analyzed by principal components PCA to find components that have good correlation with the model. For each water quality component at each point, a separate set of processing data is found after eliminating parameters with low correlation. Outlier removal is performed by the Standard Scaler method based on unit variance.
The adjusted parameters of the MLP multi-layer recurrent neural network include: hidden layer sizes (number of hidden layers), activation (activation function), solver (optimizer), learning rate. Using trial and error method, the research determined these parameters as follows: the number of hidden layers is set to 100, the activation function is relu function, the optimizer is adam, the learning rate is constant (Pham,Q.B.; Abba, S.I. et al., 2019).
The AI model requires a large amount of data to process and test the model, while the measurement data series on the Dao river is relatively short, not enough to build a reliable AI model. Therefore, the research will use the MIKE 11 model to run the model with different scenarios to create a data set for the AI model. In the AI model, input variables include: flow, BOD5, DO, Ammonia, Nitrate at the monitoring location of Hung Yen, Phu Ly. Simulated variables include: BOD5, DO, Ammonia, Nitrate concentrations at control locations Phu Le, Nhu Tan and Nam Dinh. The study created a series of input data for simulation variables according to the following principles:
- The water quality parameters BOD5, Ammonia, Nitrate are randomly generated in the range from the lower bound value which are the quality indicators for column B of QCVN 08:2023/BTNMT (qualified for irrigation purposes, irrigation) and the upper limit is the value twice the current pollutant content.
- The DO parameter fluctuates randomly within the upper limit which is the value in column B1 of QCVN 08:2023/BTNMT and the lower limit is half the DO value at the present time.
- Temperatures at all waste sources are randomly generated within the range 15-350C
River water flow, research examines changes in water flow at the borders of Ninh Binh and Hung Yen. The randomly generated flow ranges from 3-7 m3/s at day dam, while this value ranges from 5-60 m3/s at the Nam Dinh monitoring gate location. Water quality factors at these two boundaries are kept constant as current conditions.
3. Results and discusions
3.1. Results of water quality simulation using MIKE 11 model
The model was calibrated in 2 steps with 2015 hydrological data by changing parameters in the model (Manning roughness coefficient in the HD module and diffusion coefficient in the AD module) until the model results were consistent with actual measurement results. Then the model was tested using the 2016 database.
Calibrate the HD model through changing the manning roughness system in the range of 0.03-0.018.
Figure 4 and Figure 6 show the results of water quality calibration at the monitoring locations. The results show that the model results agree with the actual measurements in both values and trends.
With the set of parameters of the MIKE 11- HD Model, along with water quality data, the study calibrated the MIKE11-ECOLab model for Dao river water quality in Nam Dinh province, the results are as follows:
Table 3. Parameter set for Water Quality Model
|
No |
Some parameters of the Model ECOLab |
Default |
Calibrate |
|
1 |
Oxygen consumption rate of animals and plants in water |
3 |
3 |
|
2 |
ate of maximum photosynthetic oxygen intake |
3,5 |
40 |
|
3 |
Decomposition rate at temperature 20oC |
0,5 |
0,5 |
|
4 |
Temperature coefficient for decay rate |
1,02 |
1,02 |
|
5 |
N-NH4 conversion rate from BOD5 decay |
0,29 |
0,5 |
|
6 |
Ammonia decay rate in 20oC |
1,54 |
0,3 |
|
7 |
Coliforms decay rate |
0,7 |
0,01 |
|
8 |
P-PO4 conversion rate from decay BOD5 |
0,009 |
0,6 |
|
9 |
Decay constant for phosphorus particles |
0,1 |
0,05 |
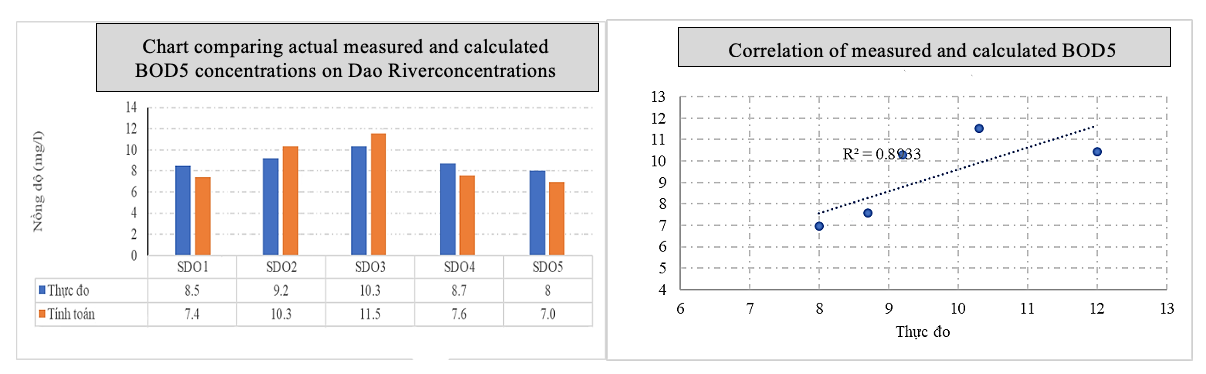
Figure 5. Comparison of results of adjusting BOD5 concentration values actually measured and calculated from the model at monitoring points in 2017
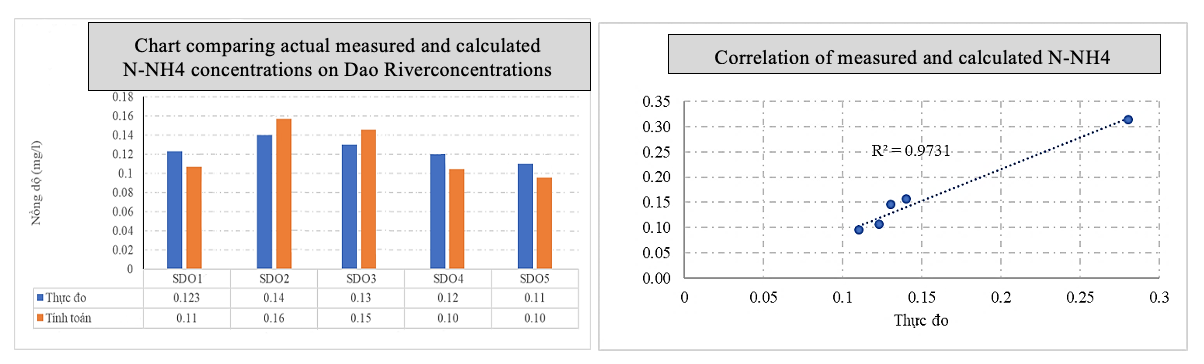
Figure 6. Comparison of calibration results of N-NH4+ concentration values actually measured and calculated from the model at monitoring points in 2017
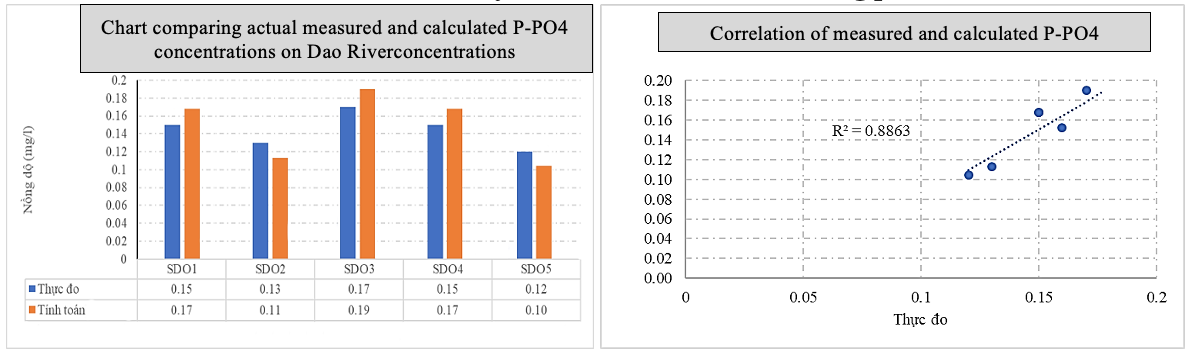
Figure 7. Comparison of correction results of P-PO43 concentration values actually measured and calculated from the model at monitoring points in 2017
The MIKE 11-HD model simulates well the hydraulic flow on the river network system in Nam Dinh province and surrounding areas, the Nash index at Nam Dinh station is very high (from 0.92 to 0.98), the total error fluctuates between 5%÷10%, which means the simulation quality is satisfactory.
The MIKE 11-AD and MIKE - ECOLab models also simulate well the evolution of Dao river's water quality with relatively high Nash criteria (from 0.81 to 0.97), and the value error is less than 5%, this proves that The MIKE11-AD and MIKE – ECOLab models ensure reliability in simulating Dao River water quality.
3.2. Results of water quality simulation using AI model
The processing of input data is evaluated by the correlation coefficients R2, which represents the reliability of the processing results from the AI model in research (ANN–MLP). Besides, the level of reliability is also evaluated through the Nash index (NSE). Simulation model calculated at locations: Hung Yen, Phu Ly, Gian Khau and Ba Lat, Phu Le, Nhu Tan, Nam Dinh Table 1, Figures 7, 8 present the results of testing the AI model corresponding to this parameter.
Table 4. Correlation coefficient between R2 of NSE index comparing results from MIKE 11 Model and AI Model
|
Location |
BOD5 |
DO |
NH4+ |
NO3– |
||||
|
|
R2 |
NSE |
R2 |
NSE |
R2 |
NSE |
R2 |
NSE |
|
Hung Yen |
~1,00 |
0,98 |
0,98 |
0,98 |
0,98 |
0,98 |
0,98 |
0,96 |
|
Phu Ly |
0,99 |
0,99 |
0,98 |
0,98 |
0,97 |
0,97 |
0,98 |
0,98 |
|
Gian Khau |
0,98 |
0,97 |
0,99 |
0,99 |
0,98 |
0,99 |
0,98 |
0,99 |
|
Ba Lat |
~1,00 |
0,98 |
0,98 |
0,98 |
0,99 |
0,98 |
0,98 |
0,97 |
|
Phu Le |
~1,00 |
0,98 |
0,99 |
0,99 |
0,99 |
0,96 |
0,99 |
0,99 |
|
Nhu Tan |
0,99 |
0,99 |
0,98 |
0,98 |
0,98 |
0,98 |
0,98 |
0,98 |
|
Nam Dinh |
0,99 |
0,98 |
0,98 |
0,99 |
0,99 |
0,98 |
0,98 |
0,99 |
If the variation due to the residual is smaller, that is, the distance from the observation points to the regression estimate line is smaller, the variation due to regression will be higher, and then the R2 value will be higher. The results obtained from data processing at all stations reached R2 values from 0.98 to ~1, showing that the prediction ability of the AI model is close to the results from the MIKE11 model. Index NSE also achieved high reliability results from 0.96 to 0.99 respectively.
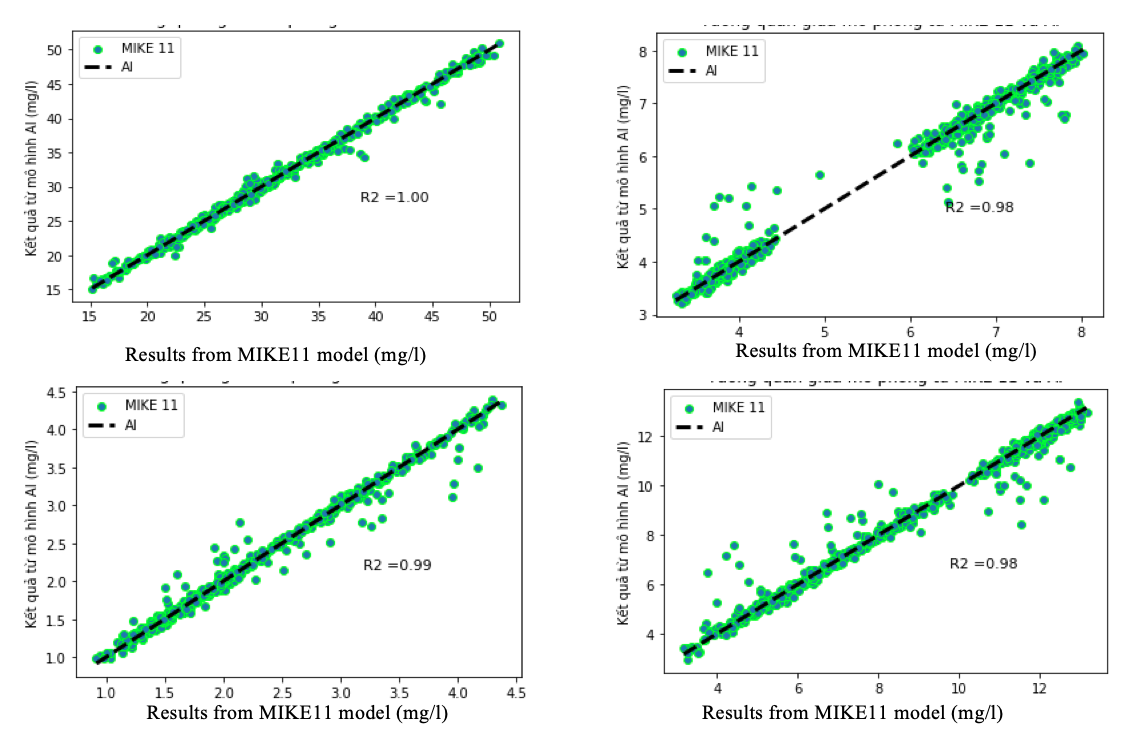
Figure 8. Correlation between simulation results from MIKE 11 model and AI at Nhu Tan point: (a) BOD5 concentration; (b) DO concentration; (c) NH4+; concentration; (d) NO3–.concentration
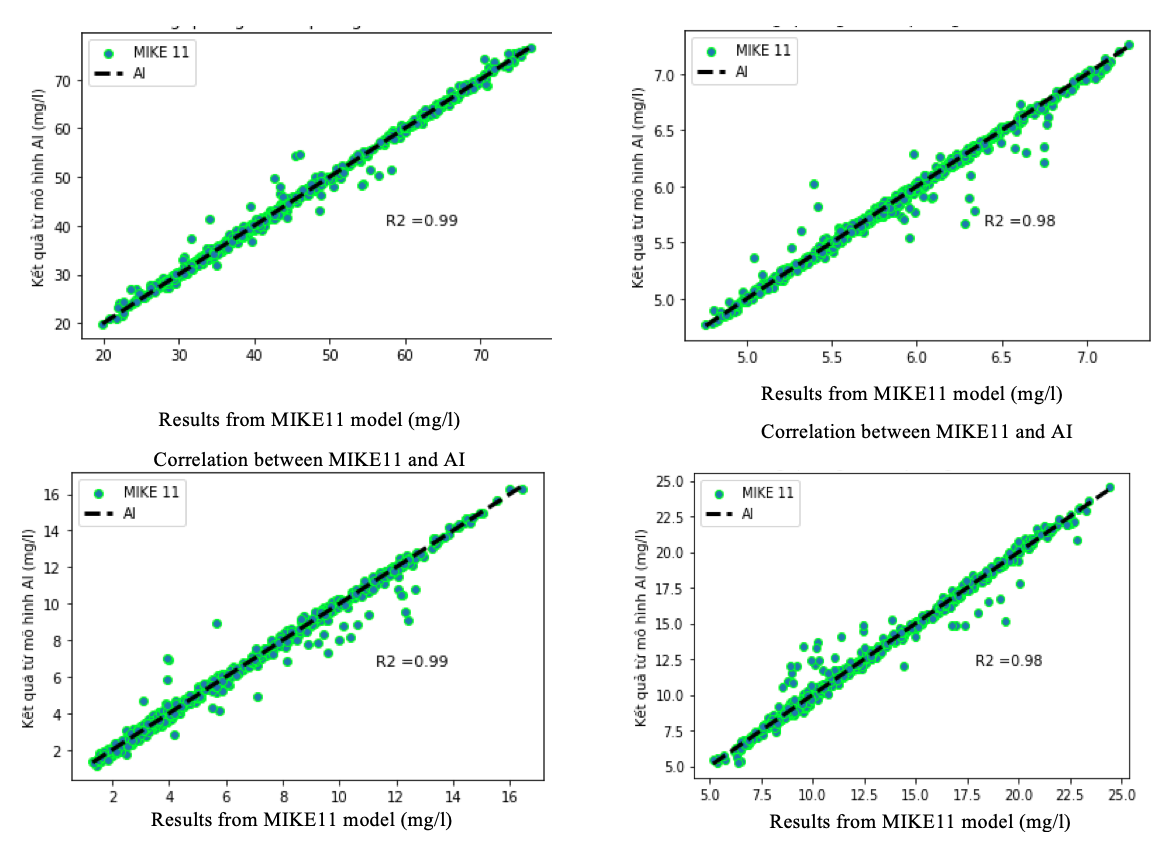
Figure 9. Correlation between simulation results from MIKE 11 Model and AI at Nam Dinh site: (a) BOD5 concentration; (b) DO concentration; (c) NH4+ concentration; (d) NO3–.concentration.
With results considered reliable, the AI model allows forecasting water quality of the Dao river surface in different scenarios.
4. Conclusion
The results of this study show that the method of using the MIKE11 model combined with the AI model simulates river water quality relatively accurately. The AI Multilayer Perceptron regression network (ANN-MLP) model has been applied to simulate BOD5, DO, Ammonia, Nitrate concentrations in Dao river. The results obtained from data processing at all stations achieved an R2 index from 0.98 to ~1, showing that the AI model's predictive ability is close to the results from the MIKE 11 model. AI model allows simulation of surface water quality on the Dao river instead of the MIKE11 model, and is the basis for building a model to predict river surface water quality for future scenarios. This is a tool to perform forecasts at a fast speed, convenient for research, simulation, forecasting and monitoring of water quality.
Thus, through water quality simulation using the MIKE11 model and the AI model, it has been assessed that the water quality situation on the Dao river is generally still in good condition, with the ability to receive additional waste sources if the waste sources are cleared and treated before discharge into the environment. However, with the current rapid economic development in Nam Dinh province, followed by the discharge of domestic and production water into the Dao river, the risk of water pollution is increasingly evident. Therefore, to minimize the risk of pollution and protect Dao river water quality, Nam Dinh province needs to plan and gradually invest in the construction of centralized urban wastewater treatment works for the urban area of Nam Dinh city to reduce the amount of pollutants in domestic wastewater flowing down the river and canal system surrounding the city into the Dao river.
To further perfect this model, in addition to the results already achieved, it is necessary to continue to simulate other water quality parameters: Phosphorus, Coliform, Ecoli, from which a more accurate and general assessment of water quality can be achieved river water quality. At the same time, it is possible to expand and develop further research on forecasting and controlling water quality pollution sources for the Dao river water source in particular and the river system in general using this model.
Nguyễn Thành Công
Hanoi Architecture University
(Source: The article was published on the Environment Magazine by English No. II/2024)
REFERENCES
1. Ministry of Natural Resources and Environment (2023), National technical regulation on surface water quality - Regulation QCVN 08:2023/BTNMT
2. Decision No. 124/QD-UBND dated January 15, 2016 of Nam Dinh Provincial People's Committee on Approving Nam Dinh province's water resources planning to 2020, orientation to 2030.
3. Department of Natural Resources and Environment of Nam Dinh province.(2017). Report on Monitoring Results of the current environmental status of Nam Dinh province;
4. Department of Natural Resources and Environment of Nam Dinh province.(2018). Report on Monitoring Results of the current environmental status of Nam Dinh province;
5. Chau, K.W.(2006). A review on integration of artificial intelligence into water quality modelling. Mar. Pollut. Bull. 52(7), 726-733.
6. Xuân, T.T. (2012). Water resources of main river systems in Vietnam. Science and Technology Publishing House, Hanoi, p. 298.
7. Hằng, V.T.(2010). Assessing the impact of climate change on water resource fluctuations in the Nhue-Day river basin in Hanoi city (Doctoral thesis, Master of Science thesis, Hanoi University of Natural Sciences.
8. Tayfur,G; Singh, V.P.(2011). Predicting mean and bankfull discharge from channel cross-sectional area by expert and regression methods. Water Resour.25(5), 1253-1267.
9. Techow, V; Maidment, D.R.; Mays,L.W.(1994). Applied hydrology - Translated by Do Huu Thanh - Education Publishing House.
10. DHI Water and Environment (DHI).(2009).MIKE 11 User Manual. DHI, Demark.
11. DHI. MIKE 11, A modelling system for rivers and channel, user guide. http://manuals.mikepoweredbydhi.help/2017/Water_Resources/MIKE11_UserManual.pdf.
12. Pham,Q.B.; Abba, S.I.; Usman, A.G.; Linh, N.T.T.; Gupta, V.; Malik, A.; Costache, R.; Vo, N.D.; Tri, D.Q.(2019).Potential of hybrid data–intelligence algorithms for multi–station modelling of rainfall. Water Res. Manage, 33(15), 5067–5087.
13. Chena, Y.H.; Chang, F.J.(2009). Evolutionary artificial neural networks for hydrologicalsystems forecasting. J. Hydrol, 367(1-2), 125-137.
14. Haghiabi, A.H.; Nasrolahi, A.H.; Parsaie, A. (2018). Water quality prediction using machine learning methods. Water Quality Res. J, 53(1), 3-13.
13. Hải, C.H.; Phương, T.A.; Như, T.Q.; Cường, T.M. (2019). Applying AI models to forecasting flow to Ba River basin lakes. Journal of Hydrometeorology, 705, 22-33.
14. Philippe, B. (2003). The WGNE survey of verification methods for numerical prediction of weather elements and severe weather events. Meteo- France, Toulouse,.
15. Chen, Yingyi.(2020) A review of the artificial neural network models for water quality prediction. Applied Sci., 10(17), 5776.
16. Ighalo, J.O.; Adewale, G.A.; Gonçalo, M.(2021).Artificial intelligence for surface water quality monitoring and assessment: a systematic literature analysis. Model. Earth Syst. Environ, 7(2), 669-681.
17. Han, H.G.; Qiao, J.F.; Chen, Q.L.(2012). Model predictive control of dissolved oxygen concentration based on a self–organizing RBF neural network. Control Eng. Pract., 20, 465-476.
18. Rajaee, T.; Boroumand, A. (2015). Forecasting of chlorophyll-a concentrations in South San Francisco Bay using five different models. Appl. Ocean Res. 53, 208-217.