
11/12/2025
ABSTRACT
This study aimed to develop a practically viable method for extracting terephthalic acid (H2BDC) from polyethylene terephthalate (PET) waste. Response surface methodology (RSM) was employed to examine the influence and interaction of extractant (NaOH) concentration, hydrolysis time, and size of PET waste on the optimal H2BDC yield. Experimental results demonstrated that NaOH concentration significantly impacted both H2BDC yield, following the effects of hydrolysis time and size of PET waste. Under optimal conditions involving a temperature of 160 °C and a 12 h reaction time with 15% NaOH, the yield model predicted an 81.58% yield, which closely matched the experimental results of 84.56%. The findings highlight the high PET-derived H2BDC quality, meeting commercial product criteria with evidence of high purity. This method presents a promising solution for extracting H2BDC from PET waste, with potential implications for the recycling industry and a positive environmental impact.
Keywords: Terephthalic acid, Polyethylene terephthalic (PET), Response surface methodology.
1. INTRODUCTION
PET bottles have been popularly used for packaging, household goods, clothing, and construction, and have dominated the consumer market over the years. Especially, in developing countries and developed countries, such as Nigeria, Namibia, India, and Vietnam, resulting in the generation of a large amount of PET waste [1, 2]. However, the recycling percentage has remained at a low ratio of only 16%, while the majority are released into landfills and the ocean, leading to a threat to the ecosystem [3, 4]. Significant increase in global plastic manufacture from 1.7 million tonnes in the 1950s to 367 million tonnes by 2020, and is predicted to reach around 590 to 1200 million tonnes by 2050 [2, 5]. Currently, production reaches 414 million tonnes, with PET making up 257 million tonnes of the total, and approximately 177 million tonnes of PET waste are discharged into the environment. Asia is recognized as the world’s second-largest producer of plastics, contributing 19.7% of the global total. This analysis underscores the necessity of developing efficient recycling strategies, both to mitigate the environmental impact and to enhance the economic value of plastic waste [6, 7].
Polyethylene terephthalate (PET) contains approximately 85 wt% terephthalic acid (H₂BDC), a highly valuable precursor for the Synthesis of carbonaceous materials and a fundamental linker in the construction of diverse Metal–Organic Frameworks (MOFs) [8, 9]. Accordingly, the development of efficient recycling strategies for PET waste offers multiple benefits, including extending its material life cycle, alleviating plastic pollution, generating high-value secondary products, and reducing dependence on finite non-renewable feedstocks.
During the past decade, mechanical and chemical techniques have been widely used for recycling PET waste. [10-12]. Mechanical recycling has been extensively applied to reprocess PET waste, yielding secondary products including textile fibers, strapping materials, and regenerated beverage bottles. [5, 13, 14]. Nevertheless, this approach demands elevated processing temperatures (250–280°C) and typically involves labor-intensive sorting and repeated reprocessing, which ultimately diminishes the quality and economic value of the final products [15]. Chemical recycling methods present a promising alternative to mechanical approaches, as they tackle the challenge of plastic recycling by decomposing polymers into their basic chemical constituents [11, 16-18]. The chemical approach fully decomposes PET polymer waste into its monomeric units, which can be repolymerized into high-purity PET, thereby enabling its use in high-performance applications [19]. Exhibiting high efficiency under relatively low conditions of temperature and pressure, this approach offers a cost-effective and energy-efficient pathway for PET degradation [11, 20]. Chemical recycling provides a more sustainable and economically practical strategy for tackling issues related to plastic recycling [16, 21].
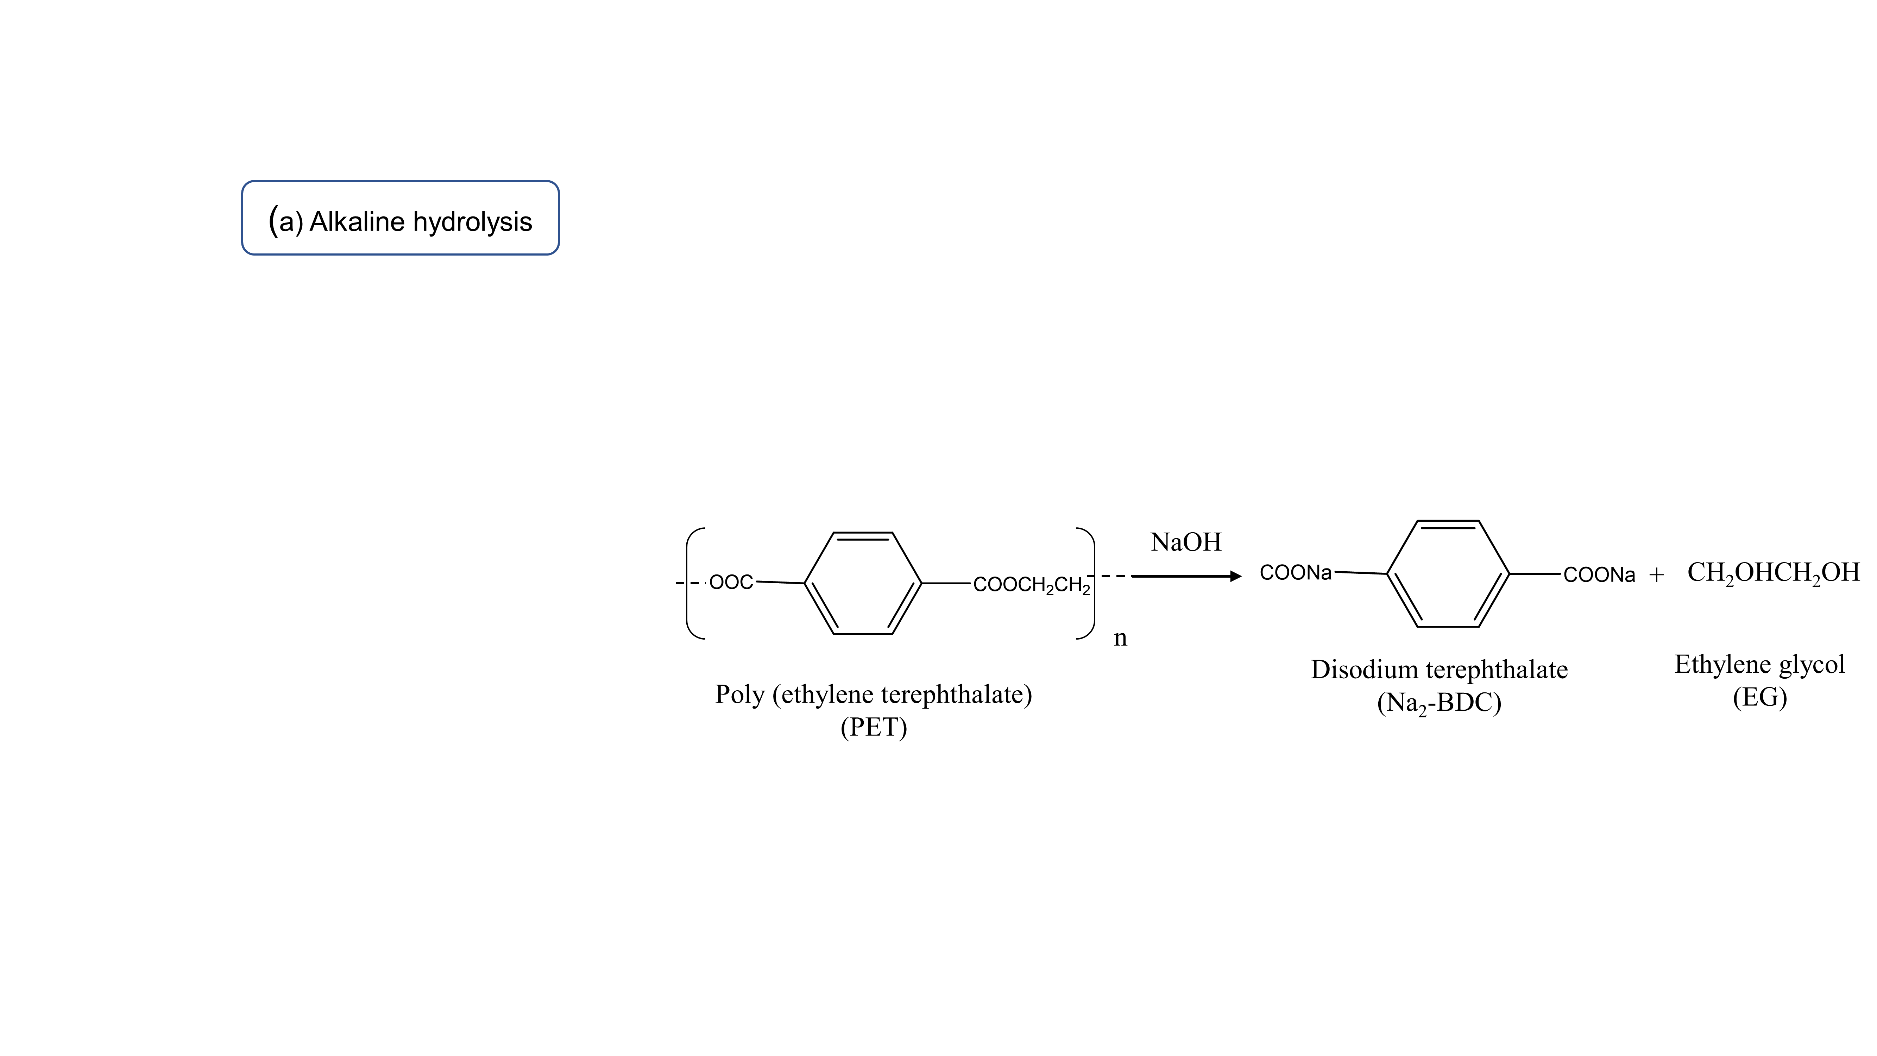
The chemical approach includes various techniques such as hydrolysis, glycolysis, aminolysis, and methanolysis [22]. Hydrolysis represents a highly effective approach for PET conversion, decomposing PET waste into terephthalate salts and ethylene glycol (EG) [14, 16, 20] (Scheme 1). The obtained terephthalate salt can subsequently be converted into its monomer, hydrogenated H₂BDC, via an acidification process (Scheme 2). Previous studies have demonstrated that PET can be depolymerized into H₂BDC and EG through hydrolysis, with the resulting H₂BDC subsequently employed for the synthesis of Cr-MOF, which exhibits excellent performance in hydrogen storage [23, 24].

Scheme 1: PET hydrolysis process using alkaline

Scheme 2: Acidification process using sulfuric acid
Prior research has predominantly centered on extracting H2BDC from PET waste via hydrolysis and acidification techniques, showcasing promising yield and recovery ratio results. However, these studies were constrained by the reliance on hydrolysis catalysts. Moreover, previous investigations need to pay more attention to the main aspects, such as the determination of the optimum conditions for efficient H2BDC extraction from PET waste. In 2020, Jung et al. identified optimal conditions for hydrolyzing powdered PET utilizing an ultrasonicator method, yielding a substantial H2BDC output [25]. However, the study did not examine how the particle size of PET waste influences the efficiency of H₂BDC recovery during the hydrolysis process.
In summary, this study presents a cost-effective approach utilizing Response Surface Methodology (RSM), which delivers notable economic and environmental advantages. By optimizing hydrolysis parameters, RSM reduces chemical and solvent consumption, lowers energy demand, and decreases wastewater treatment costs. Accordingly, the objectives of this work are twofold: (1) to explore the interactions among independent variables—including NaOH concentration, PET particle size, and reaction time—using RSM to optimize the hydrolysis process and maximize both H₂BDC yield and recovery efficiency; and (2) to evaluate the purity of PET-derived H₂BDC under the optimized conditions in comparison with that of commercially available H₂BDC.
2. MATERIALS AND METHODS
2.1. Materials
PET waste was collected from household recycling bins in Ho Chi Minh City, Natural Resources and Environment, and subsequently prepared for experimentation. The collected PET was first dried in an oven at 90°C for 24 h, then thoroughly washed with tap water. All chemicals used in the experiments, including H₂SO₄ and NaOH, were supplied by Bach Khoa Company. All chemicals were used without the need for further purification. The characteristics of PET waste were thoroughly examined through proximate and ultimate analyses by Taiwan Environmental Protection Administration standards (NIEA R213 and R205). The study included the determination of moisture, ash content, volatile matter, and fixed carbon, with all measurements performed in triplicate to ensure accuracy and reliability. Ultimate analysis of the PET samples was conducted using an elemental analyzer (Vario MICRO, Elementar). As presented in Table 1, the PET waste exhibited a high carbon content, with a dominant ratio of approximately 54.51 ± 2.91%. The calorific value of the samples was determined using a bomb calorimeter (Parr 1341) in accordance with the NIEA E214.01C protocol. Experiments were conducted at the lab of Ho Chi Minh City University of Natural Resources and Environment.
Table 1: Basic characteristics of PET plastic waste.
|
Characteristics |
Value |
|
Proximate analysis (wt.%, as received) |
|
|
Moisture |
0.36 ± 0.05 |
|
Ash content |
0.02 |
|
Volatile matter |
94.09 ± 0.51 |
|
Fixed carbon |
5.53 ± 0.51 |
|
Ultimate analysis (wt.%, wet basis) |
|
|
H |
2.94 ± 0.58 |
|
C |
54.51 ± 2.91 |
|
N |
ND |
|
S |
ND |
|
Cl |
ND |
|
O |
42.17 |
|
Energy content (Kcal kg-1) |
|
|
Higher heating value |
5335 |
|
Lower heating value |
5316 |
ND: Not detected
2.2. The extraction process of H2BDC derived from PET waste
2.2.1 Alkaline hydrolysis process
The extraction was carried out through a two-step process involving hydrolysis followed by acidification, as depicted in Fig. 1. During the hydrolysis stage, one gram of PET flakes was treated with a solution containing varying concentrations of NaOH (5, 10, and 15%) and distilled water. The mass ratios were fixed at 3:1 for NaOH to PET and 10:1 for distilled water to PET. The hydrolysis reaction was conducted in a 100 mL Teflon-lined stainless-steel autoclave reactor. The reactor was operated at a fixed temperature of 160 °C for reaction times of 8, 10, and 12 h. After completion, it was cooled to room temperature. Subsequently, a 20% NaOH solution was introduced to adjust the pH to 14, thereby ensuring the complete dissolution of residual H₂BDC [26]. Subsequently, the unreacted solid phase of PET was separated from the mixture using a filtration.
2.2.2 Acidification process and calculation of H2BDC production yield
The precipitation efficiency was evaluated through acidification reactions carried out with 4.5 M H₂SO₄, as shown in Fig. 1. Sulfuric acid was incrementally introduced into the filtrate until the pH was lowered to 1.0, following the procedure reported by previous authors [27, 28]. During the experiments, the precipitation reactions were carried out under constant stirring at 250 rpm. The obtained H₂BDC was separated by filtration, rinsed with deionized water, and subsequently dried in an oven at 70 °C for 12 h [15]. The conversion efficiency of PET and the yield of H₂BDC were then determined. After the precipitation and cooling steps, the acid-containing aqueous phase was separated by filtration and subsequently reused for further precipitation reactions.
PET conversion and H2BDC yield (%) were determined as follows: Eqs. (1) and (2)

WPET, i is the initial weight of PET, and WPET,f is the final weight of PET that remains on the filter paper after filtration.


Fig 1: The PET-derived H2BDC extraction procedure
2.3. Experimental design for hydrolysis reaction using RSM
Response Surface Methodology (RSM) is an important statistical approach for optimizing experimental conditions while reducing the number of required trials. It enables the effective optimization, maximization, or minimization of output responses influenced by multiple variables [30, 31]. RSM is employed to simulate the interactive effects of key input variables on the output response. Among its designs, the Box–Behnken Design (BBD) is particularly valuable for analyzing linear-squares response surfaces and constructing second-order polynomial models. BBD is a spherical, three-level fractional factorial design that incorporates a central point along with midpoints on the edges of a circumscribed circle [32]. In this study, NaOH concentration, PET waste particle size, and reaction time were identified as key factors affecting the extraction efficiency of H₂BDC from PET waste. The Box–Behnken Design (BBD) was applied to establish the optimal hydrolysis conditions using the hydrothermal method in an autoclave. The design consisted of three levels (−1, 0, +1), comprising 15 experimental runs with five replicates at the central point. The independent variables were NaOH concentration, PET particle size, and reaction time, while the response variable was the H₂BDC yield [25]. These values were selected based on previous research findings and initial screening experiments, ensuring thorough coverage of the parameter space [25, 33]. Specifically, NaOH concentrations between 5 and 15%, PET waste particle sizes ranging from 2.0 to 12 mm, and hydrolysis durations of 8 to 12 h were examined, as summarized in Table 2. The analytical process was further supported by Minitab software (version 20), which assisted in data interpretation and model construction. This systematic approach streamlined the optimization procedure while improving the robustness of the experimental design. The RSM results were fitted to a second-order polynomial equation, expressed as Eq. (3)[25, 34].

2.4. Characterization
The elemental composition of PET samples and the resulting H2BDC is assessed using an elemental analyzer (Vario MICRO). The calorific value of PET samples is measured with a bomb calorimeter (Parr 1341, NIEA E214.01C). X-ray diffraction (XRD, Bruker D8 Advance) with CuKα radiation (λ = 1.5406 Å) is employed to obtain the diffraction patterns of H2BDC, using a scan rate of 0.03° s⁻¹ across the 2θ range of 5–80°. Fourier transform infrared (FTIR) spectra (Frontier MIR/FTIR) are collected in the wavelength range of 650 - 4,000 cm⁻¹ at a resolution of 0.4 cm⁻¹. The morphology of H2BDC is characterized via field emission-scanning transmission electron microscopy (FE-SEM, Leica Stereoscan 420).
3. RESULTS AND DISCUSSION
3.1. Optimization of the hydrolysis process using the RSM
3.1.1. Development of the regression model
The preliminary results of H2BDC extraction from PET waste are summarized in Table 2, showing that NaOH concentration, particle size, and reaction time had a significant impact on both PET conversion and H2BDC yield. The maximum yield of 84.56 ± 0.79 % was achieved under the conditions of 15% NaOH, 2 mm particle size, and a 12 h reaction time at a fixed temperature of 160 °C. The results in Table 2 served as a foundation for selecting and designing the experimental conditions of the independent variables for RSM. Data obtained under the designed experimental conditions were then applied to develop the regression model. The statistical parameters presented in Table 3 revealed that the linear-squares model provided the most accurate prediction of H2BDC yield, evidenced by a high predicted R-squared value (R-pred = 0.89), a highly significant P-value (0.000), and a low predicted residual error sum of squares (PRESS*) of 148. Furthermore, this model exhibited the highest adjusted determination coefficient (R-squared adj = 0.95) and the lowest PRESS* among all the evaluated models (as shown in Table 3), accounting for 95% of the response variation.
The reliability of the linear-squares model was assessed using statistical parameters and the ANOVA results presented in Table 4. An F-value of 47 indicated significant variation among the group means, confirming the strong significance of the model. The P-value for H2BDC yield was below 0.0001, while the "Prob > F" values for nearly all terms in Table 4 were less than 0.05, and a small predicted residual error sum of squares (PRESS*) of 148, demonstrating that the linear-squares model and its terms were statistically significant at the 95% confidence level. The adjusted R² value of 0.95 and the predicted R² value of 0.89 showed no substantial difference, indicating that the linear-squares model effectively describes the experimental data. Additionally, the variance inflation factor (VIF) of 1.00 for all of the model's factors, obtained from the RSM results using Design of Experiments, confirmed the independence of the variables in the model. From Table 4, the Lack of Fit F-value of 931 exceeded the significance level of α = 0.05, proving that it was not statistically significant. This result suggests there is only a 0.1% probability that the Lack of Fit F-value occurred due to random noise [25]. Overall, the statistical evaluation demonstrates that the linear-squares model is both highly significant and reliable for interpreting the experimental data. Accordingly, the linear-squares regression equation for H2BDC yield is presented in Eq. (4).

X1, X2, and X3 are symbols of particle size (mm), reaction time (h), and NaOH concentration, respectively. Yield (%) is H2BDC production.
Table 2: Comparison results between experimental and predicted H2BDC yield.
|
STT |
Particle size (mm) |
Reaction time (h) |
NaOH (%) |
H2BDC yield (%) |
Residual (%) |
|
|---|---|---|---|---|---|---|
|
Experiment |
Prediction |
|||||
|
1 |
2 |
8 |
10 |
65.42 |
68.37 |
-1.58 |
|
2 |
2 |
10 |
5 |
56.99 |
58.42 |
0.02 |
|
3 |
2 |
10 |
15 |
82.12 |
79.30 |
1.56 |
|
4 |
2 |
12 |
10 |
76.63 |
75.25 |
0.21 |
|
5 |
7 |
8 |
5 |
46.13 |
45.92 |
1.68 |
|
6 |
7 |
8 |
15 |
68.28 |
66.80 |
0.17 |
|
7 |
7 |
10 |
10 |
65.12 |
65.07 |
0.14 |
|
8 |
7 |
10 |
10 |
64.99 |
65.07 |
0.02 |
|
9 |
7 |
10 |
10 |
64.97 |
65.07 |
0.00 |
|
10 |
7 |
12 |
5 |
54.02 |
52.80 |
-0.06 |
|
11 |
7 |
12 |
15 |
70.59 |
73.68 |
-1.57 |
|
12 |
12 |
8 |
10 |
58.60 |
57.50 |
-0.11 |
|
13 |
12 |
10 |
5 |
47.37 |
47.55 |
-1.46 |
|
14 |
12 |
10 |
15 |
67.05 |
68.43 |
0.08 |
|
15 |
12 |
12 |
10 |
64.65 |
64.38 |
1.68 |
|
Optimal conditions |
2 |
12 |
15 |
84.56 ± 0.79 |
81.58 |
-2.98 |
Table 3: Summary statistics of model fitting for H2BDC production yield
|
Source |
R-sq(adj) |
R-sq(Pred) |
F-value |
P-value |
PRESS* |
|
Linear |
0.87 |
0.79 |
33 |
0.000 |
276 |
|
Linear - squadres |
0.95 |
0.89 |
47 |
0.000 |
148 |
|
Linear -interaction |
0.85 |
0.58 |
15 |
0.001 |
559 |
|
Quadratic |
0.97 |
0.82 |
48 |
0.000 |
243 |
* PRESS: Predicted residual error sum of squares
Table 4: ANOVA of linear-squares model for H2BDC yield
|
Source |
DF |
Adj SS |
Adj MS |
F-Value |
P-Value |
VIF |
|
|
Model |
6 |
1298 |
216 |
47 |
0.000 |
|
|
|
Linear |
3 |
1203 |
401 |
86 |
0.000 |
|
|
|
Particle size |
1 |
236 |
236 |
51 |
0.000 |
1.00 |
|
|
Time |
1 |
94 |
94 |
20 |
0.002 |
1.00 |
Significant |
|
NaOH |
1 |
872 |
872 |
188 |
0.000 |
1.00 |
|
|
Square |
3 |
95 |
32 |
6.8 |
0.013 |
|
|
|
Particle size*Particle size |
1 |
22 |
22 |
4.8 |
0.059 |
1.00 |
|
|
Time*Time |
1 |
5 |
5 |
1.08 |
0.329 |
1.00 |
|
|
NaOH*NaOH |
1 |
62 |
62 |
13.44 |
0.006 |
1.00 |
|
|
Error |
8 |
37 |
4.6 |
|
|
|
|
|
Lack-of-Fit |
6 |
37 |
6.2 |
931 |
0.001 |
|
Not significant |
|
Pure Error |
2 |
0.01 |
0.007 |
|
|
|
|
|
Total |
14 |
|
|
|
|
|
|
α = 0.05
3.1.2. Proposed regression model analysis
The validity of the proposed linear-squares model was further assessed using Fig. 2. The bell-shaped residual histogram in Fig. 2a confirmed the normality assumption of the model. As shown in Table 2, the experimental H2BDC yields closely matched the values predicted by the linear-squares regression model, demonstrating strong agreement. These findings indicate that the proposed linear-squares model provides reliable and accurate predictions of the experimental outcomes [35, 36]. Furthermore, Fig. 2b illustrates that the internally studentized residuals versus fitted values remained within the ±2.0 range, with no abnormal deviations, confirming the suitability of the experimental data for the predicted values derived from Equation (4). The normal probability plot of residuals shown in Fig. 2c was used to assess the assumption of constant variance. The even distribution of data points on both sides of the line supports the validity of the proposed model. In addition, the diagnostic plot closely followed a straight line, indicating no need for data smoothing. Therefore, the proposed linear-squares model is considered reliable for predicting experimental outcomes.

Fig 2: (a) Histogram of residual values and frequency; (b) Standardized Residual and Fitted Value of the linear-squares model; (c) Normal probability and internally studentized residual.
3.1.3. Optimum condition and interactive effects between variables using a Pareto chart and a three-dimensional response surface
In this study, the Box–Behnken Design (BBD) was applied to optimize the independent variables, including particle size, reaction time, and NaOH concentration for maximizing H2BDC yield. Desirability was employed as the selection criterion for each parameter, ranging from 0 (completely undesirable) to 1 (highly desirable). As shown in Fig. 3, the optimized conditions of 2 mm particle size, 12 h reaction time, and 15% NaOH resulted in a maximum H2BDC yield of 82.78%, with a desirability value of 1.00. The model-predicted yield was in close agreement with the experimental result of 84.56%, showing a residual of 2.98 (Table 2). These findings demonstrate that Response Surface Methodology (RSM) is an effective tool for optimizing PET waste hydrolysis.
The 3D response surface plots in Fig. 4 illustrate the effects and interactions of the independent variables on H2BDC yield. According to the linear-squares response model, the plots indicate that reducing particle size, increasing NaOH concentration, and extending reaction time significantly enhance H2BDC yield. The study further identified the optimal PET waste-to-water mass ratio as 1:10, consistent with findings from previous research [15, 25]. The Normal Plot of Standardized Effects highlights NaOH concentration as the most influential factor on H2BDC yield, followed by reaction time and particle size (Fig. 4d). The plot also indicates that the interaction effects among variables were negligible. Under the optimized conditions of 2 mm particle size, 15% NaOH, 12 h reaction time, and a fixed temperature of 160 °C, the depolymerization of 2.0 g of PET waste produced 1.47 g of H2BDC. This process required 6 mL of 5% NaOH solution and 20 mL of deionized water for hydrolysis, followed by 4 mL of 20% NaOH solution for neutralization and 4 mL of H2SO4 4.5 M. Overall, the results confirm that Response Surface Methodology (RSM) is a reliable tool for identifying optimal conditions and assessing variable effects in PET waste hydrolysis.
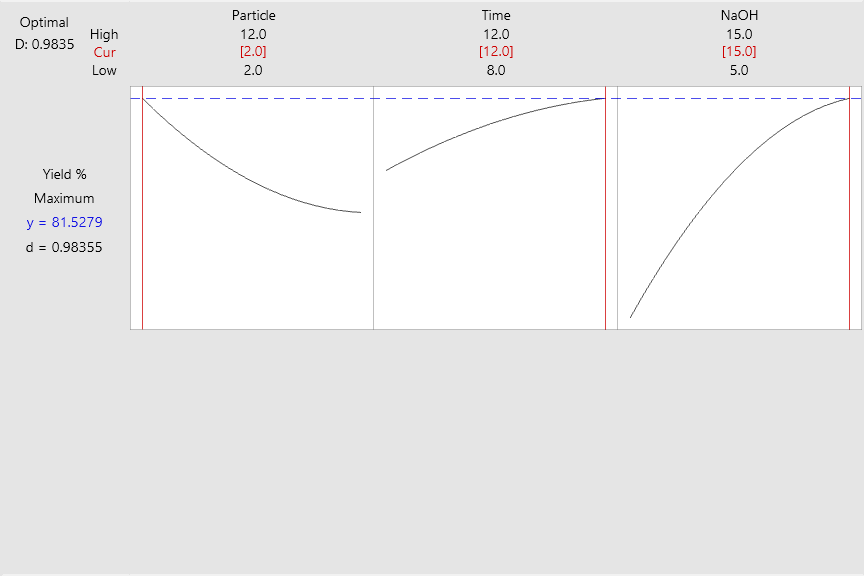
D: Desirability
Fig 3: Optimization of the H2BDC Yield

Fig 4: 3D response surface plots for H2BDC yield (a, b, and c) illustrating the interactive effects: (a) Particle size and time; (b) Particle size and NaOH; (c) Time and NaOH; (d) Normal Plot of the Standardized Effects.
3.2. Evaluation of PET-derived H2BDC quality at optimum conditions
The PXRD patterns shown in Fig. 5a display several sharp Bragg reflections at 17.2°, 25.3°, 27.9°, 29.8°, and 39.8°, confirming the high crystallinity of PET-derived H2BDC. The characteristic peaks of PET-derived H2BDC align closely with those of commercial H2BDC and agree with findings reported in earlier studies [23, 25, 37]. FTIR analysis was used to characterize the chemical structures of PET waste, PET-derived H2BDC, and commercial H2BDC, as shown in Fig. 5b. The absorption bands at 1,578, 1,511, and 1,422 cm⁻¹ correspond to the vibrational modes of the benzene ring present in both H2BDC and PET [25]. Peaks around 1,282, 2,548, and 3,062 cm-1 correspond to the stretching vibrations of carboxylic groups [16]. The absorption band at 1,678 cm⁻¹ corresponds to the stretching vibration of carbonyl groups, whereas the peak at 728 cm⁻¹ is associated with the out-of-plane bending vibrations of aromatic rings [25, 38]. In the original PET spectra, the peaks at 1,730 and 1,252 cm⁻¹ are assigned to the C=O and C–O stretching vibrations of ester bonds, respectively. A noteworthy observation in Fig. 5(a–b) is the overlap of characteristic peaks between PET-derived H2BDC and commercial H2BDC, validating the successful recovery of H2BDC from PET bottles. Moreover, the FE-SEM images in Fig. 5(c–d) reveal comparable morphologies, with the PET-derived H2BDC exhibiting smaller particle sizes than its commercial counterpart. Elemental analysis revealed that the carbon contents of commercial H2BDC and PET-derived H2BDC were 58.68 ± 1.5% and 56.64 ± 2.2%, respectively. Similarly, the hydrogen contents were nearly identical, measured at 3.6 ± 0.2% for commercial H2BDC and 3.5 ± 0.1% for PET-derived H2BDC. These results confirm that PET-derived H2BDC exhibits structural consistency, quality, and purity comparable to commercial H2BDC (99% purity), underscoring its potential for commercial-scale applications. Table 5 summarizes the extraction efficiency of PET-derived H2BDC obtained under the optimized conditions of this study in comparison with values reported in previous studies [14, 15, 25, 27, 28, 37, 39, 40]. As shown in Table 5, recent studies have focused on catalyst-assisted hydrolysis, which increases operational costs. In contrast, this study identified the optimal hydrolysis and acidification conditions without the use of catalysts, thereby achieving greater cost-efficiency.

Fig. 5 (a) PXRD pattern of PET-derived H2BDC vs. commercial H2BDC; (b) Comparison of FTIR spectra of PET-derived H2BDC vs. commercial H2BDC and original PET. (c-d) FE-SEM image of H2BDC from commercial and PET waste.
| PET size | Agent | T (°C) | Time (h) | Catalyst | Acid | Yield (%) | Ref |
| Flakes |
NaOH (15%) |
160 | 12 | No | H2SO4 | 84.56 | This study |
| Flakes | EG | 190 | 3 | No | H2SO4 | 87 | [27] |
| Flakes | EG | 210 | 8 | No | ND | 55 | [37] |
| Granules | TPA | 220 | 4 | TPA | H2SO4 | 95 | [15] |
| Granules | ZSM-5 | 230 | 0.5 | ZSM-5 | HCl | 97 | [14] |
| Granules |
NAOH (4%) |
110 | 12 | CTAB | H2SO4 | 90 | [28] |
| Powder |
NaOH (14.5%) |
83.2 | 1.5 | TBAI | H2SO4 | 100 | [25] |
| Powder |
NaOH (10%) |
90 | 1 | TBAI | HCl | 98 | [40] |
4. CONCLUSIONS
This study determined the optimal hydrothermal conditions for PET hydrolysis, specifically a particle size of 2 mm for 12 h with 15% NaOH, with a fixed temperature of 160 °C. The process significantly improves the quality of H2BDC obtained from PET waste while lowering pollutant levels in wastewater through effective acid reuse during acidification and efficient PET recycling. Contrasting previous studies that employed catalysts without optimizing hydrolysis parameters or addressing acid recovery, this work overcomes such limitations. Overall, the results demonstrate strong potential for scaling up H2BDC production from PET in an environmentally sustainable and economically feasible manner. Future investigations will explore the application of PET-derived H2BDC in the synthesis of various MOFs and assess their performance in adsorbing and separating pollutants in water, wastewater, and air treatment.
Competing interests
The authors declare they have no competing interests.
Authors’ contributions
Thi Hong Nguyen is the first author responsible for collecting, analyzing data, and writing the main manuscript. Ms. Như Y contributed to experimental conduction, and Ms. Phuong Linh supported laboratory equipment and instruments for experiments.
Acknowledgments
The authors would like to thank the Ho Chi Minh City Natural Resources and Environment (HCMUNRE) for financially supporting this work (CT.2025.11).
Nguyễn Thị Hồng*, Nguyễn Ngọc Như Ý, Bùi Phương Linh
Ho Chi Minh City University of Natural Resources and Environment, Viet Nam
(Source: The article was published on the Environment Magazine by English No. IV/2025)
References
1. Akhator, P.E., et al., Production and characterisation of solid waste-derived fuel briquettes from mixed wood wastes and waste pet bottles. Heliyon, 2023. 9(11).
2. Onyena, A.P., et al., Baseline characterisation of microplastics in surface water, sediment, and seafood from the Escravos Estuary, Nigeria. Scientific African, 2025. 27: p. e02591.
3. Ahmed, A.A., et al., Recent progress on recycling and upcycling of PET plastic waste into high-value-added materials for versatile applications. Journal of Environmental Chemical Engineering, 2025. 13(3): p. 116678.
4. Ibor, O.R., et al., Occurrence, identification and characterization of plastic pollution from an open solid waste dumpsite in Calabar, Southern Nigeria. Environmental Advances, 2023. 11: p. 100338.
5. Neelalochana, V.D., P. Scardi, and N. Ataollahi, Polyethylene terephthalate (PET) waste in electrochemical applications. Journal of Environmental Chemical Engineering, 2025. 13(3): p. 116823.
6. Maddy Lauria, Plastic pollution, by country - one5c, (n.d.). 〈https://one5c.com/plastic-pollution-by-country-136931514/〉. 〉 (accessed March 31, 2025).
7. Li, J., et al., Machine learning modeling for hydrolysis recycling of PET waste. Green Chemical Engineering, 2025.
8. Xiahou, X., et al., From waste to strength: Sustainable valorization of modified recycled PET fibers for rheological control and performance enhancement in 3D printed concrete. Case Studies in Construction Materials, 2025. 23: p. e05144.
9. Mdlovu, N.V., et al., Synthesis, characterization, and application of MIL-101(Cr) derived from waste PET bottles for CO2 conversion to propylene carbonate. Journal of Environmental Chemical Engineering, 2025. 13(5): p. 117978.
10. Mendiburu-Valor, E., et al., Valorization of urban and marine PET waste by optimized chemical recycling. Resources, Conservation and Recycling, 2022. 184: p. 106413.
11. Chu, M., et al., Rational design of chemical catalysis for plastic recycling. Acs Catalysis, 2022. 12(8): p. 4659-4679.
12. Martín, A.J., et al., Catalytic processing of plastic waste on the rise. Chem, 2021. 7(6): p. 1487-1533.
13. Hao, L., et al., Waste-to-wealth: Sustainable conversion of polyester waste into porous carbons as efficient solar steam generators. Journal of the Taiwan Institute of Chemical Engineers, 2020. 115: p. 71-78.
14. Kang, M.J., et al., Depolymerization of PET into terephthalic acid in neutral media catalyzed by the ZSM-5 acidic catalyst. Chemical Engineering Journal, 2020. 398: p. 125655.
15. Yang, W., et al., Hydrolysis of waste polyethylene terephthalate catalyzed by easily recyclable terephthalic acid. Waste Management, 2021. 135: p. 267-274.
16. Li, H., et al., Expanding plastics recycling technologies: chemical aspects, technology status and challenges. Green Chemistry, 2022. 24(23): p. 8899-9002.
17. George, N. and T. Kurian, Recent developments in the chemical recycling of postconsumer poly (ethylene terephthalate) waste. Industrial & Engineering Chemistry Research, 2014. 53(37): p. 14185-14198.
18. Geyer, B., G. Lorenz, and A. Kandelbauer, Recycling of poly (ethylene terephthalate)–A review focusing on chemical methods. Express Polymer Letters, 2016. 10(7): p. 559-586.
19. Donnakatte Neelalochana, V., et al., Anion Exchange Membranes Based on Chemical Modification of Recycled PET Bottles. ACS Applied Polymer Materials, 2023. 5(9): p. 7548-7561.
20. Glaser, J.A., New plastic recycling technology. 2017, Springer.
21. Shen, L. and E. Worrell, Plastic recycling, in Handbook of recycling. 2024, Elsevier. p. 497-510.
22. Shojaei, B., M. Abtahi, and M. Najafi, Chemical recycling of PET: A stepping-stone toward sustainability. Polymers for Advanced Technologies, 2020. 31(12): p. 2912-2938.
23. Ren, J., et al., Green synthesis of chromium-based metal-organic framework (Cr-MOF) from waste polyethylene terephthalate (PET) bottles for hydrogen storage applications. International Journal of Hydrogen Energy, 2016. 41(40): p. 18141-18146.
24. Nguyen, T.H. and K.-Y. Chiang, Enhancement of terephthalic acid recovered from PET waste using a combination of citric acid and dimethyl sulfoxide extraction. Sustainable Environment Research, 2024. 34(1): p. 16.
25. Jung, K.-W., J.-H. Kim, and J.-W. Choi, Synthesis of magnetic porous carbon composite derived from metal-organic framework using recovered terephthalic acid from polyethylene terephthalate (PET) waste bottles as organic ligand and its potential as adsorbent for antibiotic tetracycline hydrochloride. Composites Part B: Engineering, 2020. 187: p. 107867.
26. Deleu, W.P.R., et al., Waste PET (bottles) as a resource or substrate for MOF synthesis. Journal of Materials Chemistry A, 2016. 4(24): p. 9519-9525.
27. Manju, et al., Post consumer PET waste as potential feedstock for metal organic frameworks. Materials Letters, 2013. 106: p. 390-392.
28. Wang, Y., et al., Towards recycling purpose: Converting PET plastic waste back to terephthalic acid using pH-responsive phase transfer catalyst. Chinese Journal of Chemical Engineering, 2022. 51: p. 53-60.
29. Paliwal, N.R. and A.K. Mungray, Ultrasound assisted alkaline hydrolysis of poly(ethylene terephthalate) in presence of phase transfer catalyst. Polymer Degradation and Stability, 2013. 98(10): p. 2094-2101.
30. Shahnaz, T., et al., Multivariate optimisation of Cr (VI), Co (III) and Cu (II) adsorption onto nanobentonite incorporated nanocellulose/chitosan aerogel using response surface methodology. Journal of Water Process Engineering, 2020. 36: p. 101283.
31. Hanumanthu, J.R., et al., Optimization of process conditions using RSM and ANFIS for the removal of Remazol Brilliant Orange 3R in a packed bed column. Journal of the Indian Chemical Society, 2021. 98(6): p. 100086.
32. Kumari, M. and S.K. Gupta, Response surface methodological (RSM) approach for optimizing the removal of trihalomethanes (THMs) and its precursor’s by surfactant modified magnetic nanoadsorbents (sMNP) - An endeavor to diminish probable cancer risk. Scientific Reports, 2019. 9(1): p. 18339.
33. Dyosiba, X., et al., Feasibility of varied polyethylene terephthalate (PET) wastes as linker source in MOF UiO-66 (Zr) synthesis. Industrial & Engineering Chemistry Research, 2019.
34. Hariharan, N., et al., Application of artificial neural network and response surface methodology for predicting and optimizing dual-fuel CI engine characteristics using hydrogen and bio fuel with water injection. Fuel, 2020. 270: p. 117576.
35. Alian, E., et al., Application of response surface methodology and genetic algorithm for optimization and determination of iron in food samples by dispersive liquid–liquid microextraction coupled UV–visible spectrophotometry. Arabian Journal for Science and Engineering, 2018. 43(1): p. 229-240.
36. Mahdavi, R. and S.S. Ashraf Talesh, Enhancement of ultrasound-assisted degradation of Eosin B in the presence of nanoparticles of ZnO as sonocatalyst. Ultrasonics Sonochemistry, 2019. 51: p. 230-240.
37. Ghosh, A. and G. Das, Facile synthesis of Sn(II)-MOF using waste PET bottles as an organic precursor and its derivative SnO2 NPs: Role of surface charge reversal in adsorption of toxic ions. Journal of Environmental Chemical Engineering, 2021. 9(4): p. 105288.
38. Doan, V.D., et al., Utilization of waste plastic pet bottles to prepare copper-1,4-benzenedicarboxylate metal-organic framework for methylene blue removal. Separation Science and Technology, 2020. 55(3): p. 444-455.
39. Lee, H.L., C.W. Chiu, and T. Lee, Engineering terephthalic acid product from recycling of PET bottles waste for downstream operations. Chemical Engineering Journal Advances, 2021. 5: p. 100079.
40. Khalaf, H.I. and O.A. Hasan, Effect of quaternary ammonium salt as a phase transfer catalyst for the microwave depolymerization of polyethylene terephthalate waste bottles. Chemical Engineering Journal, 2012. 192: p. 45-48.