
11/12/2025
Abstract
In recent years, brackish water shrimp farming has developed strongly and become an important economic sector of Tien Giang province. However, the reuse of polluted shrimp ponds or the discharge of sludge into the surrounding environment has polluted the surrounding water sources, affecting the economic activities and lives of people in the area. Assessment of the impact of shrimp farming wastewater on river and estuary water environment in Phu Tan commune, Tien Giang province applies the Canadian CCME water quality index. The reaserch’s results showed that the quality of the surrounding surface water is at a serious pollution level during the discharge period of shrimp ponds into the environment with TSS and COD concentrations ranging from 10.5 - 435.5 mg/L and 8.3 - 236 mg/L, both exceeding the threshold B of QCVN 08:2023/BTNMT. The research’s results also showed that most of the monitoring locations around the discharge area had TSS and COD components exceeding the threshold and WQI_CCME was very low and corresponded to a serious pollution level. This is the factor showing the impact of discharge (wastewater, sludge) from brackish water shrimp ponds in the area contributing to surface water pollution in the area.
Key words: Environmental quality assessment, pollution zoning, WQI_CCME, Brackish shrimp, Tien Giang province.
JEL Classification: Q22, Q25, Q53
Received: 1st October 2025; Revised: 20th October 2025; Accepted: 27th October 2025.
1. INTRODUCTION
In recent years, brackish shrimp farming in Tien Giang province has grown strongly, becoming an important economic sector that not only creates jobs and increases income for people but also contributes to the development of processing companies and generates significant foreign currency for the country through export activities.
With its coastal terrain and many canals, Phu Tan commune (Tan Phu Dong district, Tien Giang province) (See Figure 1) has many advantages to develop aquaculture and is the economic spearhead of the commune. According to the report of the Department of Fisheries of Tien Giang province (2024), the people of Phu Tan commune have boldly invested in upgrading and renovating ponds, bringing machinery to the dike, building extensive shrimp farming sluices, gradually upgrading the farming model from simple extensive to improved extensive, that is, the industrial shrimp farming model and especially the shrimp - rice model is developing strongly. The whole Phu Tan commune currently (2024) has 2,416 hectares of aquaculture (an increase of 12.5% compared to 2023), of which 400 hectares are industrial shrimp farming and more than 2,016 hectares are extensive farming. The shrimp farming output of the whole Tan Phu Dong district increases by an average of 12% - 15% annually. Along with the increase in shrimp farming output and area, the amount of feed for shrimp also increased sharply (20%/year - Tien Giang Fisheries Department). This put great pressure on the quality of the surrounding water environment (estuaries and coastal areas of Tien River).
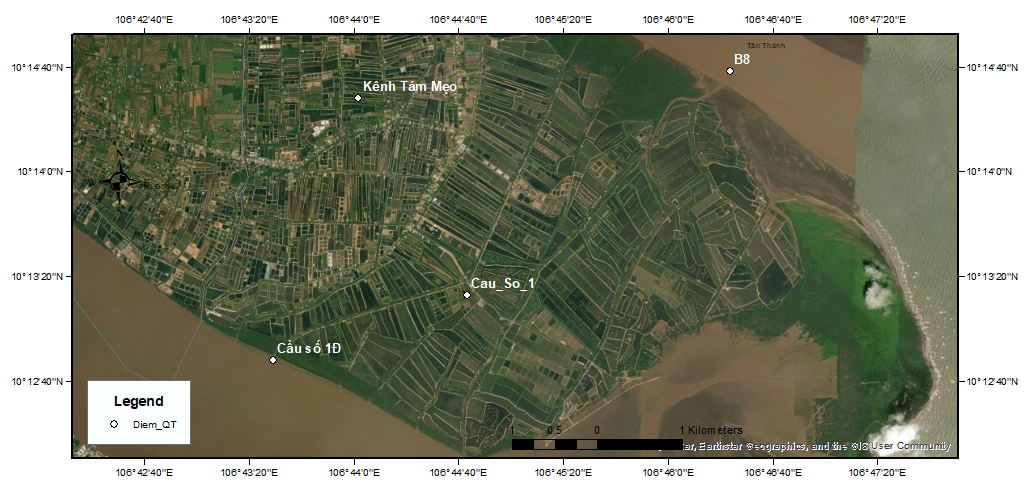
Figure 1. The brackish shrimp ponds are at Phu Tan Commune and positions of monitoring points
Brackish shrimp aquaculture in districts and towns of Tien Giang province (incuding Phu Tan Commune), it is quite developed, but people's awareness of the use of chemicals and antibiotics in shrimp farming is not high, and shrimp farmers have not paid attention to disease prevention and wastewater treatment before discharging into the environment. The amount of wastewater generated related to the stages of the farming process is the main source of pollutants. In wastewater, there are also residues of antibiotics and drugs. The presence of carbonic and organic compounds will reduce dissolved oxygen and increase BOD5, COD, H2S, ammonia, CH4 and TSS content in natural basins. The act of discharging wastewater from ponds and pumping pond bottom sludge from intensive and semi-intensive shrimp farming into natural canals without treatment will cause the canal system to sediment and the natural water environment to become seriously polluted.
Along with the development of brackish shrimp farming in particular, the general problem of environmental pollution caused by aquaculture is mainly due to excess feed, manure and excreta of farmed aquatic species. The level of pollution depends on the species, farming method, hydrological regime, type of feed and care regime. Most of the current studies on environmental pollution in aquaculture are conducted in countries where the subjects are raised in ponds/cages and fed with industrial feed (Price and Morris, 2013). Studies on the adverse environmental impacts of brackish water shrimp farming with industrial feed in coastal ponds have been conducted in many countries/regions around the world. These studies show that the components of the excess feed are often found to be maintained at quite high concentrations in the aquatic environment surrounding the farming area. According to Price and Morris (2013), about 85% of Phosphorus, 80 - 88% of Carbon and 52 - 95% of Nitrogen introduced into the farming system will be lost to the environment through excess feed, manure, excreta, and respiration; and about 50% of these nutrients will accumulate at the bottom of the pond (Price and Morris, 2013). Through the process of changing water in the pond, or cleaning the pond, these residues are discharged into the environment in many different forms.
Water quality assessment is an activity carried out in most studies on water resources (Nguyen Thi The Nguyen, 2016). Quality assessment is often carried out in the following main directions: (i) Analysis and comparison of important water components with standards and regulations to make judgments about the level of component pollution (Ott Wayne, 1978); (ii) Comprehensive assessment of a group of water quality components, usually in the formula of an index with a quality level classification table (House M. A. and Newsome D. H., 1989); (iii) Assessment of the carrying capacity or ability to receive additional waste; and (iv) Assessing the ability to self-improve or clean up at different levels to represent the “intrinsic quality” of water sources… Among these assessment directions, assessment and classification of pollution levels according to indexes are widely used both in terms of space and the nature of each water source component (Nguyen Thi The Nguyen, 2016). For estuaries and coastal areas, there are many formulas for calculating water quality according to indexes. Among them, the formula for calculating the WQI_CCME index was developed by the British Columbia Ministry of Environment, Land and Parks (Rocchini and Swain 1995) and incorporates modifications developed by the province of Alberta and is similar to the Alberta Agricultural Water Quality Index (Wright et al. 1999). The main reason for applying this index is because the study area is located in an estuary - coastal area that is regularly affected by tides and has a fairly high salinity concentration.
The main difference of WQI_CCME is (1) the method of calculating a coefficient related to the amplitude of water quality components compared to the standards, (2) the number of water quality components varies according to regional conditions and monitoring levels; (3) it is not necessary to fix the components and the number of components between assessment locations, (4) it is applied to all water components (fresh, brackish, salty, non-alum) in areas (inland, estuaries - coastal, sea) (Nguyen Thi The Nguyen, 2016).
To assess the impact of brackish water shrimp farming activities in Phu Tan commune, Tan Phu Dong district, Tien Giang province on water quality in the Tien River estuary (Cua Dai and Cua Tieu) and coastal waters, the study assessed the changes in water quality component concentrations (TSS, DO) and WQI_CCME index in the months before and after discharging pond water in April, May, June, July and August 2024. (DO component is related to the decomposition of organic matter, TSS is related to sludge from aquaculture ponds)
2. METHODS
2.1 The study area
The research was carried out in Phu Tan commune, Tan Phu Dong district, Tien Giang province (See Figure 2). The area has a very high shrimp farming density (See Figure 1). Brackish water shrimp ponds and discharge canal system with the monitoring positions in the study area (See Figure 2).
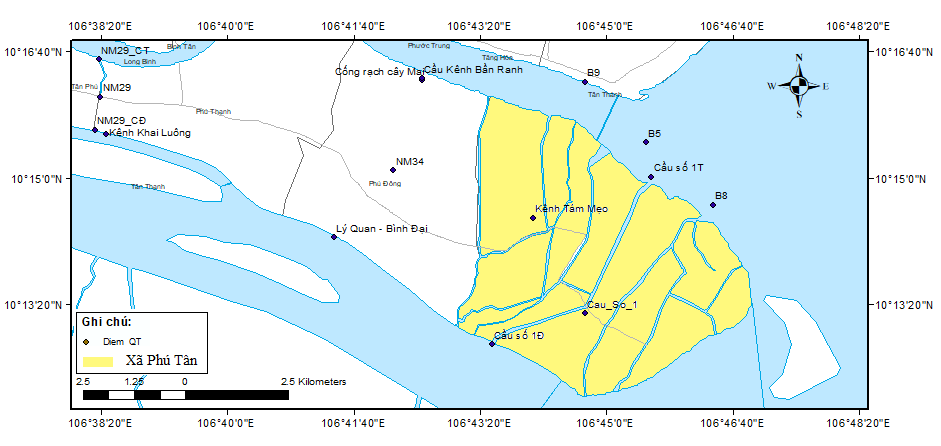
Figure 2. The study area – Phu Tan Commune (Yellow color) and positions of monitoring points
Figure 2 shows the water quality monitoring stations, in which Cau So 1 station and Kenh Tam Xeo station are the places that directly receive wastewater from shrimp ponds, and the surface water quality monitoring stations on Tien River flowing through the area. With the increasing level of area and number of crop, the shrimp farms make the large impacts on the local water environmental quality. The surface water quality monitoring points in the area are listed in Table 1 below.
Table 1. The position of water quality monitoring locations
|
Name of position |
Coordinate X |
Coordinate Y |
Location |
|
Cau So 1 |
106.745 |
10.220 |
Canal |
|
Kenh Tam Meo |
106.734 |
10.241 |
Canal |
|
Cong Rach Cay Mai |
106.710 |
10.271 |
Canal |
|
Cong Rach Xeo |
106.777 |
10.398 |
Canal |
|
NM06 |
106.373 |
10.342 |
River |
|
NM07 |
106.546 |
10.300 |
River |
|
NM29 |
106.638 |
10.277 |
Canal |
|
NM34 |
106.697 |
10.245 |
Canal |
|
B5 |
106.759 |
10.258 |
Coast |
|
B6 |
106.804 |
10.186 |
Coast |
|
B7 |
106.790 |
10.286 |
Coast |
|
B8 |
106.773 |
10.244 |
Coast |
|
B9 |
106.745 |
10.271 |
Coast |
2.2. Water quality data set
The water quality monitoring data set in the study area was conducted from 2020 to 2024 with a frequency of once a month, the number of water components is 10 components on Tien River and 5 components on canals receiving wastewater directly from aquaculture ponds. There are generally 6 monitoring times on Febuary, April, June, August, October and December. Below is a table of water quality parameter values in February 2023 (See Table 2).
Table 2. The water quality set in February 2023
|
Positions |
T0 |
pH |
DO |
TSS |
COD |
BOD5 |
N-NO3- |
P-PO43- |
Coliform |
N-NH4+ |
N-NO2- |
|---|---|---|---|---|---|---|---|---|---|---|---|
|
0C |
mg/L |
mg/L |
mg/L |
mg/L |
mg/L |
mg/L |
mg/L |
mg/L |
mg/L |
||
|
Cau So 1 |
29.00 |
8.20 |
4.00 |
15 |
17.2 |
|
|
|
|
|
|
|
Kenh Tam Meo |
29.00 |
8.10 |
4.00 |
12 |
15.9 |
|
|
|
|
|
|
|
Cong Rach Cay Mai |
29.50 |
8.10 |
4.00 |
12 |
15.2 |
|
|
|
|
|
|
|
Kenh Khai Luong |
29.00 |
8.00 |
4.00 |
12 |
17.3 |
|
|
|
|
|
|
|
NM6 - My Tho fishery port. |
29.60 |
8.81 |
5.41 |
31.2 |
9.3 |
5 |
0.72 |
0.08 |
13000 |
0.13 |
0.051 |
|
NM7 - Cong Vam Giong |
30.40 |
8.75 |
6.29 |
27.1 |
18.4 |
10 |
0.61 |
0.10 |
5400 |
0.17 |
0.021 |
|
NM29 - Cau Rach Nhiem |
28.40 |
7.45 |
6.46 |
34 |
22.7 |
12 |
0.56 |
0.059 |
11000 |
0.22 |
0.010 |
|
NM34 - Cau Ly Quan |
28.10 |
7.51 |
5.78 |
3.6 |
30.7 |
17 |
0.64 |
|
19000 |
0.07 |
|
|
B5 |
28.10 |
7.90 |
7.95 |
21.6 |
9.0 |
|
|
|
780 |
|
|
|
B6 |
29.00 |
7.81 |
7.95 |
34 |
11.0 |
|
|
|
680 |
|
|
|
B7 |
27.90 |
7.87 |
7.99 |
42.1 |
11.0 |
|
|
|
120 |
|
|
|
B8 |
28.60 |
7.86 |
7.94 |
33 |
16.0 |
|
|
|
170 |
|
|
|
B9 |
28.20 |
7.85 |
7.90 |
46 |
10.0 |
|
|
|
790 |
|
|
(Source: Centre of Environment Monitoring of Tien Giang Province, 2024)
Water quality components focus on nutrients and organic components including BOD5, COD, N-NO2, N-NH4, P-PO43-, TSS, DO and pH.
2.3. Water quality assessment by index CCME WQI
The WQI_CCME calculation method is built on many different data using a statistical process with at least 4 parameters and 3 main coefficients: F1, F2, F3 (CCME, 2001).
WQI_CCME method is built on many different data using a statistical process with at least 4 water quality parameters for each main coefficient (Duop Chan Kujiek, 2023). In addition, the WQI_CCME index allows calculations for many different water sources from mainland to coastal saline water with corresponding surface water assessment standards (Duop Chan Kujiek, 2023).
Therefore, to determine the pollution threshold according to the WQI_CCME index, QCVN 08:2023/BTNMT will be applied to mainland surface water monitoring locations and QCVN 10:2023/BTNMT to coastal surface water monitoring locations.
The Canadian water quality index (WQI_CCME) (CCME, 2001) is calculated as follows:
 (1)
(1)
Where are:
F1– Range: is the ratio of parameters that do not meet the guideline level during the index calculation period, % of parameters exceeding the regulations.
F1 = Number of parameters not meeting standards/Total number of monitored parameters. (2)
F2 – Frequency: % of times each parameter exceeds the specification.
F2 = Number of monitoring results not meeting standards/Total number of monitoring results (3)
F3– Amplitude: the extent (deviation) by which parameters exceed the specified range.

The final results of WQI_CCME index are evaluated based on the scale presented in Table 2.
Table 2. Water quality classification table based on index WQI_CCME
|
Levels |
CCME_WQI |
Meaning of levels |
|
1 |
95 – 100 |
Excellence |
|
2 |
80 – 94 |
Good |
|
3 |
65 – 79 |
Mean |
|
4 |
45 – 64 |
Poor water quality |
|
5 |
0 – 44 |
The water quality is very bad. |
2.4. Mapping water quality zoning by index WQI_CCME
Mapping the water quality zoning for the period 2020-2024 according to the WQI_CCME index using ArcGis software with map layers of Tien Giang province. The regional surface water quality distribution maps will visually show the quality fluctuations over time of shrimp farming in the basin and the impact times of wastewater discharge from shrimp ponds.
3. RESULTS AND DISCUSSION
3.1. The status of water quality on period 2020-2024
According to the report of the Department of Aquaculture (2024) of Department of Agriculture and Rural Development of Tien Giang province (2024), the area of raw shrimp farming (intensive and semi-intensive) has exceeded the plan with the farming area reaching 749.8 thousand hectares, an increase of 1.7% compared to 2023 and focusing on strong development in Phu Tan and Go Cong Dong districts, places with favorable brackish water sources. This leads to the shrimp farming calendar of the area being year-round. Shrimp farmers can rotate continuously depending on market conditions and investment capital for their production. Thus, due to the irregular schedule of brackish water shrimp farming in Phu Tan commune, this leads to the spontaneous situation of shrimp farming and uncontrolled intaking fresh water and discharging wastewater from the ponds, causing a risks to brackish shrimp farming such as disease, unstable and low brackish water shrimp harvest.
Normally, the brackish shrimp farming season usually starts at the end of January and being harvested in early June in Phu Tan Commune. Thus, there are 2 times when wastewater from the pond is discharged into the environment through the canals, around the beginning of February and the end of June.
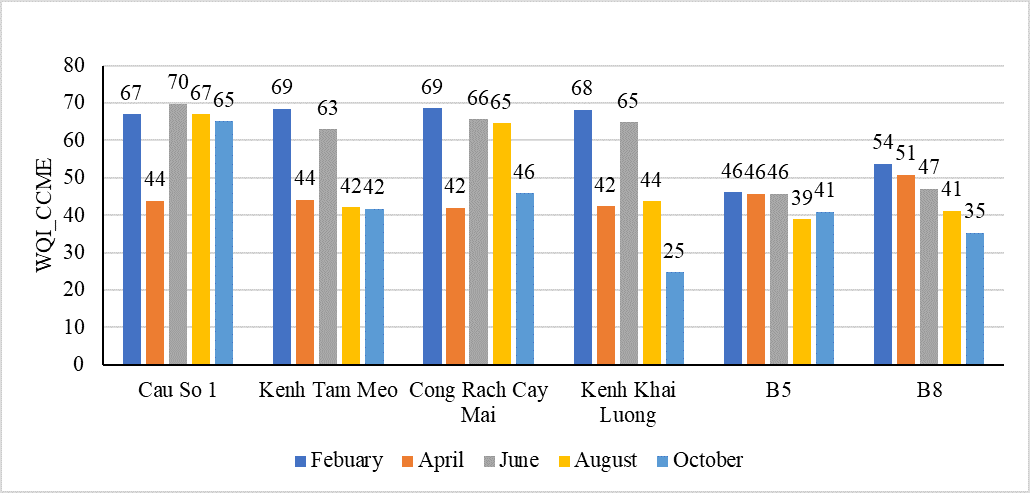
Figure 3. Fluctuations in WQI_CCME values in February, April, June, August and October 2023 in Phu Tan commune area
Thus, the quality of surface water in the canals and Tien River (river and coastal areas) fluctuates strongly between months, especially in the months after stocking and after harvest (April, August, October) (See Figure 3 - example of water quality fluctuations in 2023). According to Table 2 - classification of water quality levels, the water quality level on Tien River (estuary and coastal areas) is often polluted in April, August and October (after the beginning of the shrimp breeding season).
According to the surface water quality report of the Centre of Environmental Quality Monitoring of Tien Giang province for the period 2020 - 2024, the dissolved oxygen concentration at mainland locations fluctuated from 3.16 - 6.57 in 2020 and from 4.63 - 6.14 in 2024; at coastal locations decreasely fluctuated from 4.97 - 7.85 in 2020 and from 5.71 - 6.63 in 2024 (See Figure 4). Thus, compared with QCVN 08:2023/BTNMT and QCVN 10:2023/BTNMT, water quality corresponding to DO components at continental monitoring locations fluctuated from level C to B, at coastal monitoring locations reached and was equivalent to level B.
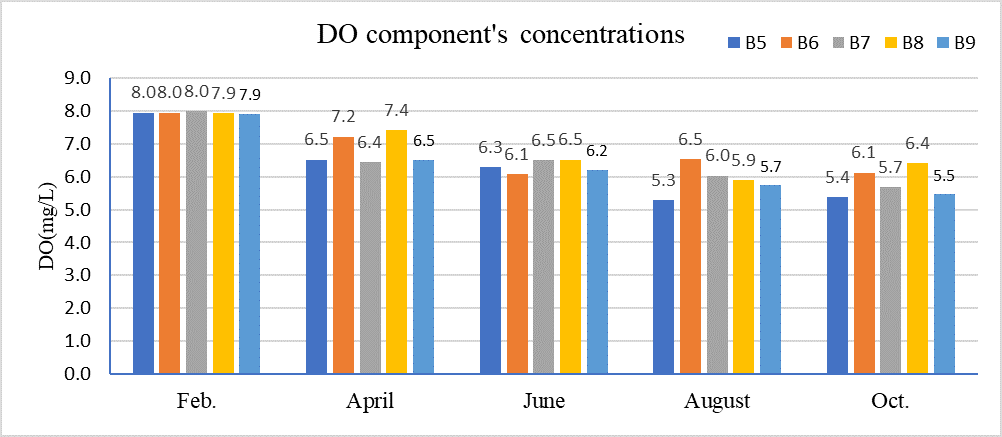
Figure 4. Fluctuations in DO’s concentrations in 2024 in Phu Tan commune area
Similarly, TSS components increased sharply in the last months of the year (increased dozens of times) due to sludge following wastewater from ponds into the surface water environment of the area (See Figure 5).
Usually, in the last months of the year, water quality declines a lot compared to the first months of the year because shrimp crops usually end in the middle and end of the year (from May to November).
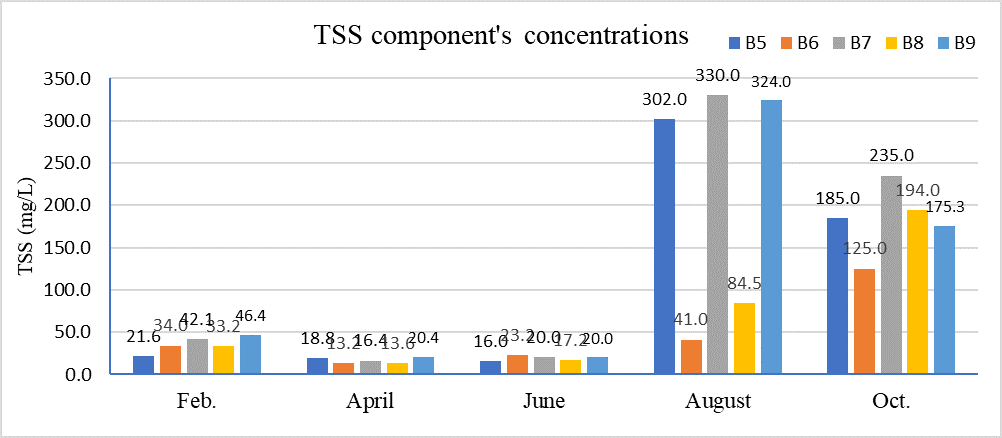
Figure 5. Fluctuations in TSS component concentration in 2024 in Phu Tan commune area
3.2. The impact of shrimp farming wastewater discharge on regional water environment in the study area
To calculate the quality of water sources around rivers, estuaries and coastal areas (fresh, brackish, salty), the study applied the method of assessing water quality according to the CCME_WQI index for the period 2020-2024 in the area around Tan Phu Dong district, Tien Giang province. To see the fluctuations in water quality and the impact of wastewater from brackish shrimp ponds in Phu Tan commune, the study used ArcGis software to show the distribution by time and zoning by year and time period. Based on Table 2 - classifying water quality according to the calculated WQI_CCME index value to assess the level of water quality in the study area.
Thus, even in the dry and rainy seasons, the water quality in the canals and Tien River (river and coastal areas) is gradually decreasing but is still between levels 3 and 5 (Badwater quality level) (See Figure 6 – the distribution of water quality level in Tien River (estuary and coastal area) on period 2020 – 2024).
The main monitoring points for wastewater and sludge discharge from brackish water shrimp ponds in Phu Tan commune are: Cau So 1, Kenh Tam Meo, Cong Rach Cay Mai and Kenh Khai Luong.
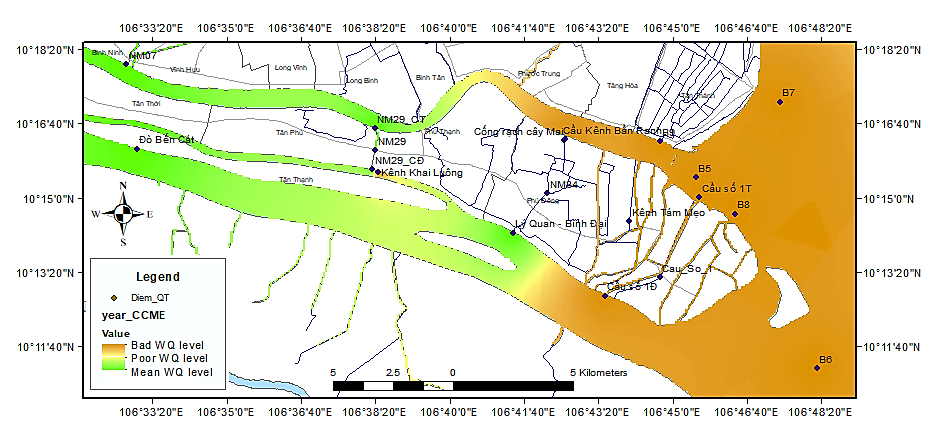
Figure 6. Distribution of WQ level on period 2020 - 2024 in Phu Tan commune area
With the discharge schedule of brackish shrimp pond wastewater in February and June every year, the water quality around the research area on Tien River is greatly affected and according to the tidal hydrological regime, this impact also spreads to the estuary and coastal waters (See Figures 7, 8 and 9 corresponding to the water quality distribution around April, June and August 2024 – for example).
Figures 7 and 9 show that after the period of releasing shrimp pond water into the environment (April and August), the water quality on the Tien River decreased and fluctuated between levels 4 and 5 (poor water quality and pollution level).
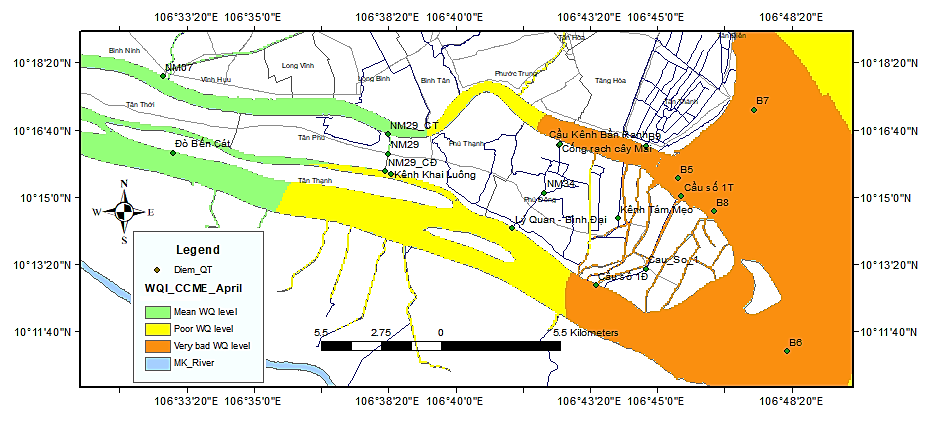
Figure 7. Distribution of water quality levels of Tien River (Estuary and coastal areas) in April, 2024
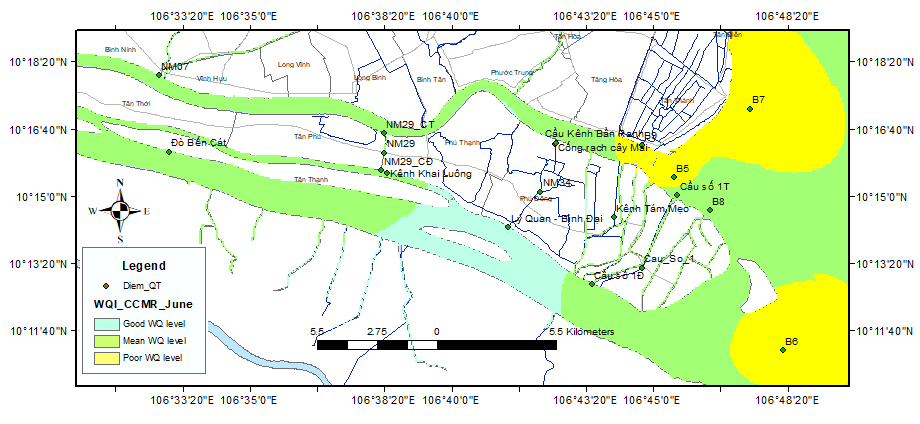
Figure 8. Distribution of water quality levels of Tien River (Estuary and coastal areas) in June, 2024
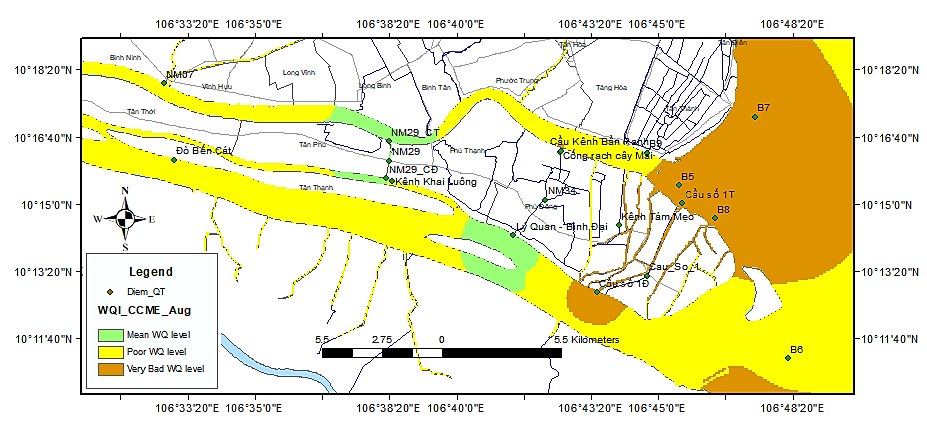
Figure 9. Distribution of water quality levels of Tien River (Estuary and coastal areas) in August, 2024
Figure 8 shows that the Tien River estuary in June, the water quality improved rapidly. June is the middle of the shrimp farming season (shrimp farming period) from May to July. This also shows that the ability to self-improve water quality in the area is quite good when the dissolved oxygen concentration in the area is always greater than 5 mg/l along with a very large flow.
4. CONCLUSION
Phu Tan Commune, Tan Phu Dong District, Tien Giang Province is a key commune of the brackish shrimp farming industry with high density and quite large productivity. Along with the development of this main economic sector, although environmental issues have been concerned by local management levels and many control solutions have been proposed, the situation of environmental pollution in the surrounding water environment has not improved and is tending to worsen. Research on the assessment of the quality of surrounding water sources with wastewater from brackish shrimp ponds in the area shows that the water quality is showing a clear downward trend (although the quality level is still at an average level) in the period 2020 to 2024. The research results show that the impact of wastewater from shrimp ponds is great. The discharge of households is not really well managed and farming practices and spontaneous farming movements. Thus, there needs to be a solution to manage both the season and discharge.
Zoning the level of water quality in the area also shows that the impact level of brackish shrimp farming wastewater in the study area is clear with the level at mean and low mean levels, while the surrounding area is at a fair to good levels.
The study results are limited to a small area and do not assess all other important wastewater sources (such as upstream development areas). Therefore, the study results can be part of the environmental information for reference by management agencies.
Nguyễn Thị Phương Thảo 1, Bùi Việt Hùng 1,*
1University of Science- Ho Chi Minh City, Vietnam National University - Ho Chi Minh
(Source: The article was published on the Environment Magazine by English No. IV/2025)
REFERENCES
1. Centre of Environment monitoring of Tien Giang Province (2024). Report on water and air quality in Tien Giang province in 2024. Tien Giang’s People Committee.
2. Department of Aquaculture of Tien Giang province (2024). The report on aquaculture situation in Tien Giang province in 2024. Tien Giang’s People Committee.
3. Duop Chan Kujiek (2023), Water quality assessment of Elgo river in Ethiopia using CCME, WQI and IWQI for domestic and agricultural usage, Heliyon 10 (2024) e23234
4. House M. A. and Newsome D. H. (1989). Water Quality indices for the management of surface water quality, Water Sciences Technology, 21, 1137-1148.
5. Nguyen Thi The Nguyen (2016). Research on selecting the method of synthesizing sub-indices when calculating seawater quality index, Science and Technology of Water Resources and Environment, 54, 42-48.
6. Ott Wayne (1978). Environmental indices theory and practice, Ann Arbor Science. Michigan, USA.
7. Price C.S., Morris Jr.J. A., 2013. Marine cage culture and the environment: twenty-first century science informing a sus tainable industry. NOAA Technical Memorandum NOS NCCOS 164. 158 pp.
8. Rocchini, R. and L.G. Swain. 1995. The British Columbia Water Quality Index. Water Quality Branch, Environmental Protection Department British Columbia Ministry of Environment, Lands and Parks. B.C. 13pp.
9. The Canadian Council of Ministers of the Environment CCME (2001). Canadian Water Quality Guidelines for the Protection of Aquatic Life.
10. Wright, C.R., K.A. Saffran, A.-M. Anderson, R.D. Neilson, N.D. MacAlpine, and S.E. Cooke. 1999. A Water Quality Index for Agricultural Streams in Alberta: The Alberta Agricultural Water Quality Index (AAWQI). Published by Alberta Agriculture, Food and Rural Development. Edmonton, AB. 35 pp.