
10/01/2024
Abstract:
Based on the assessment of the status of greenhouse gas (GHG) emissions in each field of agricultural production in Dong Thap Province according to IPPC and related studies, Project has proposed solutions to reduce GHG emissions in each respective field and estimate the effectiveness of GHG emission reduction. The results show that the total GHG emissions in 2021 and 2022 are 8,697.91 and 8,872.88 thousand tons of CO2 equivalent/year; GHG emissions is mainly from farming activities (accounting for 73% to 78%), followed by agricultural waste (16% to 20%), aquaculture (about 6%) and livestock farming (< 1%). However, when applying the proposed solutions, the effectiveness of reducing GHG emissions reaches 73,4%. If afforestation is applied and maintained, Dong Thap Province will continue to reduce GHG emissions by about 80%. Besides, to be effectively and successful in GHG emissions reducing, it is necessary to have financial support from the Government and people's awareness in environmental protection.
Keywords: Dong Thap Province; greenhouse gas emissions; agriculture sector; agricultural waste.
JEL Classification: Q15; Q53; Q56.
Received: 10th September 2023; Revised: 15th October 2023; Accepted: 13th November 2023.
1. INTRODUCTION
Vietnamese agriculture accounts for about 30 percent of national GHG emissions. The main types of GHG emissions in the agricultural field include CH4, N2O and CO2. Quantifying emissions of each type of GHG in agricultural production show that agricultural activities are also the cause of global climate change.
In Dong Thap Province, the agricultural sector accounts for about 8.62 percent GRDP, the agricultural land accounts for about 75.39 percent of the natural area of the Province [3]. To be able to evaluate the status of GHG emissions as well as the potential and effectiveness of reducing GHG emissions in agriculture, Dong Thap Province needs to deploy GHG emissions calculations in agricultural production sectors. Estimating GHG emissions can help the Province set quantitative emissions reduction targets in the next period, monitor and evaluate efforts to reduce GHG emissions compared to usual emissions scenarios according to timelines consistent with the national GHG inventory activity.
2. DATA COLLECTION
2.1. Overview of agriculture in Dong Thap Province in 2022 [3]
Dong Thap Province's agriculture sector has proactively implemented many production transformation solutions to promote growth, ensure food security and bring high economic efficiency to farmers.
Livestock farming: The Province's livestock industry has prospered, with many large-scale investment projects applying high technology in the form of production chains have been built and operated. The livestock industry is continuing to shift from small-scale farms, not ensuring biosecurity and low efficiency to medium and large-scale farms ensuring biosecurity.
Fishery: Aquaculture production and fishery catching reached 616.9 thousand tons, an increase of 1.05% compared to 2021, of which aquaculture production reached 596.7 thousand tons, accounting for 96.7%. Aquaculture area is concentrated in Tam Nong, Cao Lanh and Chau Thanh districts.
Crop production: Total production cereals reached 3,270.5 thousand tons, a decrease of 104.3 thousand tons compared to 2021, of which paddy production reached 3,235 thousand tons, a decrease of 104 thousand tons (Spring paddy production reached 1,384.8 thousand tons, a decrease of 50.2 thousand tons; Autumn paddy production reached 1,850.2 thousand tons, a decrease of 53.8 thousand tons). Perennial crops and fruit crops (oranges, tangerines, mangoes, longans) increased compared with in 2021.
Pesticides (plant protection chemicals)[13]: Dong Thap province's paddy area ranks third in the country and its fruit tree area is quite large. Therefore, every year, people use many pesticides to prevent pests and diseases. According to the report of Dong Thap Plant Protection and Cultivation Sub-Department, the total amount of fertilizer used is 350,642 tons per year, and pesticides are 8,974 tons per year.
Fertilizers: Farmers are used to using chemical fertilizers for crops and are not used to using organic fertilizers. The amount of fertilizer used for rice cultivation is gradually decreasing with area; For other crops such as vegetables, corn, potatoes, etc., the amount of fertilizer used gradually increases over cultivated area.
2.2. Agricultural waste
By-products in farming: According to statistics from the Institute for Agricultural Environment (2018), The amount of by-products from paddy is the largest with over 45 million tons of straw/year, followed by sugarcane with the amount of sheaths and old leaves is over 20 million tons/year, next leaf stalks of corn, cassava plant, vegetables and coffee husks [11]. Agricultural by-products are being left over and burned. They are not used effectively, causing emissions and environmental pollution. With the ratio of straw/paddy is 1.05/1 (Trần Anh Tuấn et al., 2019), the estimated number of straw by-products generated is about 3,396.75 thousand tons in 2022.
Livestock waste: livestock waste is mainly manure, dead animal carcasses, leftover animal food, bedding materials and other waste, with moisture from 50% to 83% and high NPK ratio. With the emission coefficient referenced from the study of Vũ Chí Cường (2013), the total amount of livestock waste is 1,531.75 tons of solid waste and 1,170 tons of liquid waste.
Aquaculture waste: Waste in aquaculture is wastewater, sludge... formed mainly from shrimp and fish feces, leftover food, algae, chemicals (lime, zeolite...) used in the farming process, with solid waste generated from shrimp farming is 123 tons/crop/ha and wastewater is more than 5,000 m3/ha, the amount of solid waste generated from pangasius farming is about 33.3 tons of sludge/ha (including mud and water) [4]. Meanwhile, resources for aquatic environmental protection activities (including finance and human resources) are still limited.
3. POTENTIAL GHG EMISSIONS FROM AGRICULTURAL ACTIVITIES IN DONG THAP PROVINCE
3.1. GHG emissions due to agricultural activities in Dong Thap Province
3.1.1. GHG emissions in livestock farming
According to the guidance of IPCC (2006), based on number of livestock, GHG emissions are calculated as follows:
Total CO2 emissions = Number of livestock x emission coefficient x conversion factor
- CH4 emission coefficient from food digestion (intestinal fermentation) of Cow is 27 (kg/head), Pig is 1(kg/head) and Buffalo is 49(kg/head).
- CH4 emission coefficient from waste management process of Cow is 2.4 (kg/head), Pig is 7 (kg/head), Buffalo is 2.8 (kg/head), Poultry is 0.02 (kg/head).
- N2O emission coefficient from waste management process of Cow is 39.59 (kg/head), Pig is 13.49 (kg/head), Buffalo is 44.38 (kg/head), Poultry is 0.02 (kg/head).
Table 1: GHG emissions in livestock activities
|
Pet type |
Number of livestock |
CH4 emissions from food digestion (thousand tons/year) |
CH4 emissions from waste management process (thousand tons/year) |
N2O emissions from waste management process (thousand tons/year) |
||||
|---|---|---|---|---|---|---|---|---|
|
|
2021 |
2022 |
2021 |
2022 |
2021 |
2022 |
2021 |
2022 |
|
Cow |
37.5 |
40.8 |
1.01 |
1.10 |
0.09 |
0.10 |
1.48 |
1.62 |
|
Pig |
90.8 |
108 |
0.09 |
0.11 |
0.64 |
0.76 |
1.22 |
1.46 |
|
Buffalo |
2.6 |
2.7 |
0.13 |
0.13 |
0.01 |
0.01 |
0.12 |
0.12 |
|
Poultry |
6,841 |
6,485 |
- |
- |
0.14 |
0.13 |
- |
- |
|
Total |
1.23 |
1.34 |
0.87 |
0.99 |
2.82 |
3.19 |
||
|
Aerobic treatment |
|
|
0.017 |
0.020 |
||||
|
The conversion factor to CO2eq (IPCC, 2013) |
28 |
28 |
265 |
|||||
|
CO2eq emissions (thousand tons of CO2eq/ year) |
34.46 |
37.57 |
24.35 |
27.75 |
4.60 |
5.20 |
||
Note: Total GHG emissions from livestock activities in 2021 is 63.41 thousand tons of CO2eq /year, in 2022 is 70.52 thousand tons of CO2eq /year
3.1.2. GHG emissions in aquaculture
- Based on aquaculture area, GHG emissions are calculated as follows:
CH4 emission coefficient from shrimp, fish is 0.63 kg CH4 /ha.day (Hiraishi et al, 2013), aquaculture time of about 210 days/year for shrimp and 240 days/year for fish.
CO2 emission coefficient from shrimp, fish is 60.4 ± 1.45 kg CO2/ha/day (Nam, 2016)[6], aquaculture time of about 210 days/year for shrimp and 240 days/year for fish.
- Based on aquaculture production and N2O emission coefficient is 0.00169 kg N2O - N/kg seafood: total N2O emissions = aquaculture production x 0,00169 x 44/28.
Table 2: GHG emissions from aquaculture activities
|
Types of aquacultures |
Aquaculture area (thousand hectares) [3][10] |
CH4 emissions (thousand tons/year) |
CO2 emissions (thousand tons/year) |
N2O emissions (thousand tons/year) |
||||
|
2021 |
2022 |
2021 |
2022 |
2021 |
2022 |
2021 |
2022 |
|
|---|---|---|---|---|---|---|---|---|
|
Shrimp |
0.9 |
0.9 |
0.12 |
0.12 |
11.42 |
11.42 |
0.005 |
0.01 |
|
Fish |
4.8 |
5.1 |
0.73 |
0.77 |
71.25 |
71.25 |
1.49 |
1.57 |
|
Total |
0.84 |
0.89 |
82.67 |
87.12 |
1.50 |
1.57 |
||
|
The conversion factor to CO2eq (IPCC, 2013) |
28 |
- |
265 |
|||||
|
CO2eq emissions from aquaculture |
23.66 |
24.93 |
82.67 |
87.12 |
396.97 |
417.29 |
||
*Note: Total GHG emissions from aquaculture activities in 2021 is 503.30 thousand tons of CO2eq /year, in 2022 is 529.34 thousand tons of CO2eq /year
3.1.3. GHG emissions in farming
- Rice cultivation: Estimated CH4 content released into the environment from paddy fields as follows.
Table 3: Estimated CH4 content released into the environment from paddy fields
|
Rice cultivation |
2021 |
2022 |
|---|---|---|
|
Land area for rice cultivation (ha) [3][10] |
504,400 |
482,200 |
|
CH4 emission coefficient of 1 ha/year (kg/ha) |
382.77 |
382.77 |
|
CH4 content released in rice cultivation (kg/year) |
193,069,188 |
184,571,694 |
|
CO2eq emissions from rice cultivation |
5,405.94 |
5,168.01 |
- GHG emissions due to fertilizer use: Report calculated for two main types: Urea fertilization and lime;
Emission coefficient of lime is kg 0.12 kg CO2/kg lime (GL, 2006), average demand of lime 3,1kg/ha, thus CO2 emissions from using lime is 0.37 kg CO2/ha.
According to research by Chojnacka et al. (2019), the CO2 emission coefficient of urea is 3.47 kg CO2eq/kg Urea, average demand of urea 240kg/ha thus CO2 emissions from using urea is 832.8 kg CO2/ha.
Table 4: GHG emissions from fertilization in farming
|
Activities use fertilizer |
2021 |
2022 |
|---|---|---|
|
Fertilized area (paddy + other crops) (ha) |
541,319[3] |
522,899[10] |
|
Emission coefficient (kg CO2/ha) |
|
|
|
+ Lime |
0.37 |
0.37 |
|
+ Urea |
832.8 |
832.8 |
|
CO2 emissions from fertilizers (thousand tons/year) |
|
|
|
+ Lime |
0.2 |
0.19 |
|
+ Urea |
450.81 |
435.47 |
|
Total (thousand tons of CO2eq / year) |
451.01 |
435.66 |
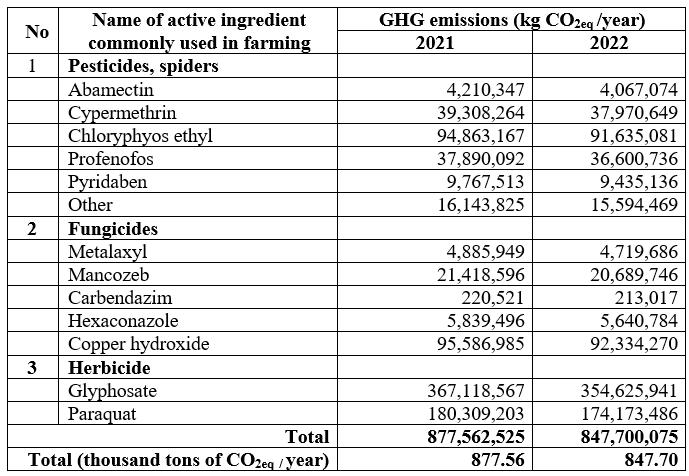
- GHG emissions from pesticide:
To calculate emissions from pesticides, it is necessary to estimate the amount of GHG emissions from agricultural pesticide production. Williams et al (2009) [1]used a linear regression method combined with an average energy value of types for pesticide production according to Green (1987), has calculated the global warming potential (100 years) is 0.069 kg CO2eq per MJ of pesticide energy. Total CO2 emissions from specific pesticides are as follows.
Table 5: GHG emissions from pesticides
3.1.4. GHG emissions from agricultural waste
In currently, no research to calculate GHG emission from waste biomass from farming as well as sludge from aquaculture. Therefore, emission coefficient of garden waste in the composition of domestic waste and wastewater (IPCC, 2006) was applied.
Table 6: GHG emissions in the waste sector in 2021 and 2022
|
Waste |
Unit |
2021 |
2022 |
||||
|
CH4 |
N2O |
Total |
CH4 |
N2O |
Total |
||
|
Disposal of solid waste into landfills |
Thousand tons of CO2eq /year |
1,389.61 |
- |
1,389.61 |
1,815.62 |
- |
1,815.62 |
|
Wastewater (untreated) |
Thousand tons of CO2eq /year |
6.43 |
0.65 |
7.08 |
5.29 |
0.74 |
6.03 |
|
Total |
1,396.04 |
0.65 |
1,396.69 |
1,820.91 |
0.74 |
1,821.65 |
|
3.2. Synthesize and compare GHG emission calculation results
Table 7: Summary of GHG emissions in the agricultural field in 2021, 2022
|
Sector |
GHG in 2021 (thousand tons of CO2eq /year) |
GHG in 2021 (thousand tons of CO2eq /year) |
||||||
|---|---|---|---|---|---|---|---|---|
|
CO2 |
CH4 |
N2O |
Total |
CO2 |
CH4 |
N2O |
Total |
|
|
Livestock farming |
- |
58.81 |
4.60 |
63.41 |
- |
65.32 |
5.20 |
70.52 |
|
Farming (rice growing, fertilizers, pesticides) |
877.76 |
5865.75 |
- |
6734.51 |
847.89 |
5603.48 |
- |
6451.37 |
|
Aquaculture |
82.67 |
23.66 |
396.96 |
503.3 |
87.12 |
24.93 |
417.29 |
529.34 |
|
Agricultural waste |
|
1,396.04 |
0.65 |
1396.69 |
- |
1820.91 |
0.74 |
1821.65 |
|
Total |
960.43 |
7335.26 |
402.22 |
8697.91 |
935.01 |
7514.64 |
423.23 |
8872.88 |
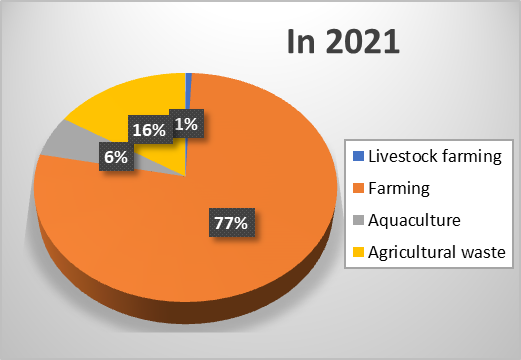
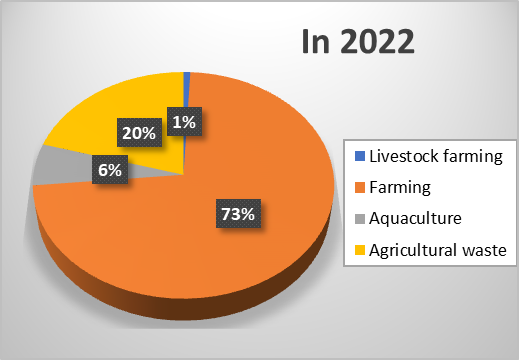
Figure 1: GHG emission rate in the agricultural sector in 2021 and 2022
Note: GHG emissions are mainly from farming activities accounting for 73% to 77%, followed by agricultural waste generation activities, accounting for 16% to 20%, emissions from aquaculture are low and livestock farming has the lowest proportion.
4. PROPOSED SOLUTIONS
4.1. Solutions to reduce emissions in farming
Applying the Alternate Wet and Dry paddy planting technique (AWD): Paddy fields are watered intermittently except for the rooting and flowering stages to reduce the time of flooding, which will reduce CH4 emissions approximately 51% compared to the traditional [9]. However, this solution requires quite a large investment cost for irrigation pumping systems and dikes; therefore, if the government does not support, it will not be attractive to farmers
Converting land from 2 to 3 paddy crops to 1 paddy crop and 1 vegetable crop: The conversion has contributed to reducing the GHG rate by 25% [9]. This is also a solution has been applied in some localities and has potential to be replicated because it brings higher economic efficiency than specialized rice cultivation. However, this solution requires specific planning on land, markets and investment costs to renovate irrigation systems and processing facilities.
Reuse 100% of biomass waste from farming activities: limit burning of waste biomass and completely reuse them, such as composting from straw to fertilize plants and produce fuel from husk, waste from fruit trees is fermented to produce feed containing probiotics for livestock.
Solutions to reduce emissions in managing and using fertilizers and pesticides
Use fertilizers appropriately: There should be specific recommendations on using fertilizers for soil, should not fertilize too much urea, leading to high NOx concentrations in the soil, that causing direct and indirect emissions of N2O, NOx, NH3 and GHG effects; should use slow-release Nitrogen to reduce nitrogen loss when fertilizing plants, while also helping to reduce GHG emissions into the environment. At the same time, people could use garden waste, sewage sludge and other organic waste from agriculture to compost, create organic fertilizer. According to the project "Sustainable paddy production and reduction of GHG emissions AgResults", using organic fertilizer in rice cultivation has helped cut 50% of GHG emissions into the environment.
Using biosafe pesticides, which are currently encouraged, including herbal pesticides and microbial pesticides...
+ Herbal pesticides: A type of pesticide that uses toxins which was extracted from plants or vegetable oils to inhibit and kill pests, such as: Neem tree juice (kill pests and aphids), solution from chili, garlic, ginger (kill pests and insects), Chrysanthemum tea (kill endothermic animal, insects and invertebrates), solution from nicotiana rustica (kills pests, butterfly pupae, aphids and mollusks such as slugs), millettia pachyloba drake (kill Taiwania circumdata, Empoasca sp., and mango hopper).
+ Microbial pesticides: active ingredients include microorganisms such as bacteria, viruses, fungi, algae or protozoa, which excrete fluids containing antibiotics, capable of eliminate pests. This bacterium secretes proteins that help repel insects to protect plants, especially potatoes and cabbage. Other types of microbial pesticides use the principle of competition for survival, bringing non-harmful microorganisms to plants and being natural enemies of harmful microorganisms to take over the habitat and repel micro-organisms from plants.
According to the results of the model "Rice cultivation reduces GHG emissions", the "1 right - 6 reduction" technical process has reduced the number of pesticides used in paddy fields by 30%.
Provide land management policies: It is necessary to advise people to manage well cropland, keep clear soil, avoid flooding, clean up plant and animal residues, and apply properly manure to limit decomposing nitrogen into GHGs by bacteria.
Although many solutions to reduce GHG emissions in the agricultural field have been researched and proposed; However, the applicability and replication of each technology depends largely on the economic efficiency that the technology can bring to farmers in addition to its environmental efficiency. Therefore, the government needs to have supportive policies to continue researching these solutions in each specific area to ensure that people continue to apply and replicate GHG emission reduction technologies in agriculture.
Maintain forest ecology
Tree planting activities will increase the ability to absorb CO2 and help exploit and use 100% of biomass from forests... so afforestation will be highly effective in reducing GHG emissions. Applying the calculation of GHG emissions according to IPCC (2006), the amount of CO2 will be reduced by about -544.60 thousand tons of CO2/year (2022).
Table 8: GHG emissions from forest ecosystems in 2022
|
No |
Planting forests |
Unit |
2022 |
|---|---|---|---|
|
I |
The amount of C absorbed |
|
|
|
1 |
Forest land area (including forestry land and land for perennial crops) [3][10] (A) |
Thousand hectares |
54 |
|
2 |
Ratio C of dry matter (CF) |
ton C/ton dry |
0.47 |
|
3 |
Average annual biomass growth (G total) |
Dry tons/ha/year |
188.49 |
|
4 |
CO2 absorption and emission from intact forest land with respect to annual increase (C gain = A x G Total x CFx (-44/12)) |
Thousand tons of CO2 /year |
-691.13 |
|
II |
Amount of C lost |
|
|
|
5 |
Wood yield (H) |
Thousand m3/year |
120.7 |
|
6 |
Biomass conversion factor into expansion factor (BCEF R) |
(m3 loss)-1 |
10 |
|
7 |
Ratio of below ground biomass to above-ground biomass (R) |
(dry tons of above-ground biomass) -1 |
0.2 |
|
8 |
Annual loss carbon due to tree loss (Lwood-removals = H x BCEF R x (1 + R) x CF) |
Thousand tons of CO2 /year |
68.25 |
|
9 |
Volume of firewood lost (FG trees) |
m3 /year |
|
|
10 |
Base wood density (D) |
Dry tons/m3 |
6.8 |
|
11 |
Annual loss carbon due to wood collection (L wood-removals = [FG trees x BCEF R x (1 + R) + EG part x D) x CF) |
Thousand tons of CO2 /year |
78.28 |
|
12 |
Amount of C lost due to intervention (L other losses) |
Thousand tons of CO2 /year |
0.00 |
|
|
Total loss (8+11+12) (C loss) |
Thousand tons of CO2 /year |
146.53 |
|
|
-544.60 |
||
4.2. Solutions to reduce emissions in livestock farming
CH4 emissions from the rumen of cattle: There should be a program to provide nutritional cakes or other nutritional products to reduce the amount of methane produced from the digestive activities of cattle. According to Van Zijderveld et. al. (2011), digestive products could convert nitrate into NH3, reducing CH4 production in the cow's rumen by up to 50%.
Model for utilizing by-products from livestock farming:
+ Model of utilizing livestock waste to produce organic fertilizer and biogas as cooking fuel; treating livestock wastewater with a biogas tank not only reduces odors but also collects gas for cooking.
+ Model of utilizing animal manure to raise earthworms: Cow manure, pig manure and fillers such as grass, straw, water hyacinth, potato plants, peanut stems... or dry leaves are used as a substrate for earthworm farming. Cinnamon is used to produce organic food, anaerobic decomposition creates biogas, and produces bioenergy.
4.3. Solutions to reduce emissions in aquaculture
Pond wastewater treatment: recirculating water in aquaculture to reduce eutrophication is a sustainable method to reduce environmental impact by both reducing wastewater discharge and helping to control disease. This solution contributes to reducing the eutrophication rate compared to traditional farming by 43.66% - 47.13% [12]
Treatment of sludge from aquaculture ponds
+ Sludge from ponds is used to fertilize agricultural land. Currently, pond areas use settling ponds to remove suspended solids in waste quite effectively; however, it is necessary to have attention to the residue of dissolved nutrients in the waste source. .
+ Phosphorus recovery: Current trends show that phosphorus resource regeneration is mainly implemented to reduce operating costs. Nutrient recovery is recognized to help control fouling in the sludge pipeline, improve sludge dewatering, reduce polymer consumption, treatment sludge volume, energy recovery. At the same time, with demanding high livestock farming and lacking land area for sludge treatment can be solved thanks to Phosphorus recovery techniques.
+ Nitrogen recovery: The main goal of nitrogen recovery (reactive Nitrogen recovery) is to shorten the nitrogen cycle and convert Nitrogen in the waste stream into artificial fertilizer (precursor form). About 30% of the Nitrogen in the waste stream, representing 4% of the nitrogen in the wastewater, can be recovered. Although Nitrogen recovery less than agricultural fertilizer needs, but Nitrogen recovery can be part of a sustainable solution.
Table 9: Estimated GHG emissions reduction from agricultural activities
|
Emissions |
GHG reduction plan |
Calculate GHG emissions in 2022 |
||
|---|---|---|---|---|
|
Initial GHG emissions |
Applying mitigation options |
Forest ecosystem |
||
|
(1) |
(2) |
(3) |
(4) |
(5) |
|
I. Cultivation |
||||
|
Rice Cultivation |
+ Planting alternate wet and dry paddy (reduce 51%) + Plant rotation of 1 rice crop and 1arable crop (reduce 25%) |
5,168.01 |
1,240.32 |
- 544.60 |
|
Fertilizer |
Use organic fertilizer from agricultural by-products (reduce 50%) |
435.66 |
217.83 |
|
|
Pesticides |
Herbal pesticides, microbial pesticides (reduce 30%) |
847.70 |
593.39 |
|
|
II. Livestock farming |
||||
|
Castle raising |
Using digestive products to reduce CH4 emissions from food digestion (reduce 50%) |
65.32 |
32.66 |
|
|
Waste management |
Collect biogas to generate electricity and reduce CH4, N2O emissions from waste management (reduce 100%) |
5.20 |
0 |
|
|
III. Aquaculture |
||||
|
Aquaculture activities |
+ Closed circular model (reduce 47.13%) + Recover P, N (reduce 30%) |
529.34 |
279.86 |
|
|
IV. Agricultural waste |
||||
|
Solid waste and wastewater |
+ Production compost from crop waste and livestock waste (reduce 100%) Collect biogas to generate electricity and reduce CH4, N2O emissions from waste management (reduce 100%) |
1,821.65 |
0 |
|
|
Total |
8872.88 |
2364.07 |
-544.60 |
|
|
Total GHG reduction (3) - (4) |
6508.82 |
|
||
Note: The efficiency of reducing GHG emissions is about 73,4%. When applying and maintaining afforestation, GHG emissions will be reduced to about 80%.
5. Conclusion
The report analyzed and evaluated the situation and trends of GHG emissions in each field of agricultural production and agricultural waste, thereby providing analysis and assessment of opportunities and challenges for reducing GHG emissions in Dong Thap Province. The potential to reduce GHG emissions in the agricultural sector is huge. However, the biggest challenge comes from limited funding to invest in waste reduction technology; in addition to the awareness, consciousness, responsibility to protect the environment and reduce GHG emissions of local people are still limited.
Specific measures to reduce GHG emissions for each type of agricultural production in Dong Thap Province are as follows: Review and issue technical guidance documents on GHG inventory for departments and relevant units to refer to before implementing contents on GHG emission mitigation in agriculture; Expand cooperation with strategic partners such as C40 Organization, JICA, World Bank.... to seek funding sources; issue handbooks to guide actions to reduce GHGs in each production fields in agriculture.
Nguyễn Văn Phước1, Nguyễn Trần Thu Hiền2, Ngô Thụy Phương Hiếu2, Nguyễn Thị Thu Hiền2
1 Ho Chi Minh City Union of Science and Technology Associations
2 Ho Chi Minh City Association for Water and Environment
(Source: The article was published on the Environment Magazine by English No. IV/2023)
REFERENCES
1. Adrian G. Williams et al. Estimation of the GHG emissions from agricultural pesticide manufacture and use. Technical Report, August 2009, DOI: 10.13140/RG.2.1.5095.3122.
2. Dr. Nguyễn Thế Hinh. Some solutions to reduce GHG emissions in Vietnamese agriculture, Environment Magazine No.2/2022.
3. Dong Thap Statistics Department. Dong Thap Province statistical yearbook, 2021.
4. Conference to discuss solutions to implement environmental protection project in fisheries activities in the period 2021 - 2030.
5. Conference on fertilizer and pesticide management in the Mekong Delta, 2021.
6. Lê Văn Nam, 2016. Initial study on the possibility of GHG emissions from coastal wetlands in Hai Phong. Journal of Marine Science and Technology. 16(3): 267-274
7. Nguyễn Văn Phước, Nguyễn Thị Thu Hiền. Estimated emissions and proposals to reduce greenhouse gases due to the use of pesticides in the citrus growing area of Binh Duong Province, Environmental Magazine, Vietnamese Topic III/2021.
8. Nguyễn Văn Phước. Research to evaluate the effects of using fertilizers and pesticides on products, the environment and human health in citrus growing areas in Bac Tan Uyen District, Binh Duong Province and propose preventive and corrective measures. Binh Duong Department of Science and Technology, 2019.
9. Nguyễn Công Thuận et.al.,. Rice cultivation techniques to save water, reduce GHG emissions and adapt to climate change. Can Tho University Science Magazine. Volume 58, Topical SDMD (2022): 231 - 238.
10. General Statistics Office. Vietnam Statistical Yearbook, 2022.
11. Mai Văn Trinh, Report on investigation of the status of rice production in Thai Binh Province. Low emission rice cultivation project. Institute of Agricultural Environment, 2018.
12. Nguyen, C.V., Overview of Agricultural Pollution in Vietnam: Aquaculture Industry. Prepared for the World Bank, Washington, DC, 2017 .
13. https://dantocmiennui.vn/dong-thap-xay-dung-thoi-quen-su-dung-thuoc-bao-ve-thuc-vat-an-toan-hieu-qua/329490.html.