
14/08/2023
Abstract:
One of the major issues in the Mekong Delta is the severe deficit of supply water due to the ferrous, alum and acidic pollutants of water in this area. This study aims to assess the performance of some popular methods to treat acid sulfate water, such as using quicklime with a solution pH range of 6 - 8 as an operating variable. Simulated acid sulfate water samples were prepared based on studies of acid sulfate content in the water of this area. The results showed that: 1) pH of 7.5 was determined to be an optimum for Al and Fe removal as qualified standards (QCVN 01-1:2018/BYT); At any values of pH, only a small amount of Mn was ydrolysed, which means after treatment, Mn was hardly removed from the solution. The result indicated that although traditional methods can treat Al and Fe, it is necessary for the water to have further treatment as the methods cannot eliminate the entire Mn and they also may heighten the hardness of water.
Keywords: Arsenate, iron hydroxide-based adsorbent, competing anions.
JEL Classifications: K32, N55, Q53.
Received: 01 March/2023; Revised: 03 March/2023; Accepted: 22 April/2023.
1. Introduction
Acid sulfate soil (ASS) is the main kind of soil in the Mekong River Delta (Vietnam), approximately 400,000 ha (occupying more than 40%) of the total area here [1, 2, 3]. ASS is consequence of drainage, which develop from the oxidation of reduced S-compounds in Pyrite (FeS2) [1,4]. Acid sulfate water (ASW) is the result of the aerobic leaching of sulfide-bearing rock, sediment, and soil into the surroundings [5] that releases sulphuric acid, in turn, releases iron species (Fe2+, Fe3+), aluminum (Al3+), and other potentially toxic elements into the soil and water systems [6]. Anthropogenic activities such as mining or soil drainage are the primary reasons for ASW; however, there are also rigorously natural occurrences [5]. Usually, ASW is orange-yellow or dark brown with very low pH [2-6], high aluminum concentration, and almost contains yellowish jarosite (KFe3(SO4)2(OH)6) mottles in the topsoil (< 1m) [1,4].
According to the Ministry of Agriculture and Rural Development, approximately 18 million people live in the Mekong Delta, of which 13 million people live in sparsely populated rural areas. In recent years, due to abnormal weather changes, large-scale saltwater intrusion, and ASW contamination, about 96,000 households have difficulty drinking water. Surface water is seriously salty, while groundwater is heavily ASW contaminated. People who invest in drilling wells cannot use it. The centralized water supply schemes do not have enough water supply, both surface water and groundwater. On the other hand, most households live in areas far from rural centralized water supply schemes, making it challenging to expand water supply pipes. The lack of clean water for use leads to higher water prices, but people can only sometimes afford it.
Concerning the increasing shortage of fresh water, under the pressure of regional demand and the contribution of ASS dewatering activities to the decrease in safe freshwater supplies, management and treatment efforts to avoid these effects are needed [7]. Several methods have been applied to deal with ASW, like coagulation, adsorption, ion-exchange, filter membrane, and even filter machines, and so on. Nevertheless, due to economic conditions and sparse distribution, it is hard for households to set up modernized and centralized water treatment systems. Then, simplified methods have been chosen to treat. The most common one is to mix an alkaline material (usually agricultural lime) into the water, where it can react with acidity and neutralize it, leading to the fact that acid sulfate cannot be removed entirely.
This paper aims to evaluate the efficacy of simplified treatment processes (including using burnt lime and aeration). To do this, the simulated ASW was created and then dealt with by these processes. The ASW samples experienced three stages: (1) Using quicklime (CaO) to increase the pH of ASW, and (3) Filtering precipitates with filter papers. The results could help to construct the following stages or be used as a reference for offering alternative methods.
2. Material and method
2.1. Water sample preparing
Typically, ASW has a pH range of 2 - 6, with the most extreme concentration of approximately 2 in ASS areas and the highest concentration of Fe2+, Al3+, Mn2+ was 70 mg/L, 3 mg/L, and 5 mg/L, respectively. Therefore, stock solution S1 was created with the highest concentrations based on studies in section 1. The composition of AS contaminated water (1L) includes: 0.35g FeSO4.7H2O (1.25 mM); 0.07g Al2(SO4)3.18H2O (0.11 mM); 0.02g MnCl2.4H2O (0.09 mM); 0.4g CaSO4.2H2O (10 mM); 0.5g NaCl (5.63 mM) [1,9,10,11]. The pH was regulated by H2SO4 and NaOH solutions and measured using Mettler Toledo M200 easy pH meter. Water samples S4, S7, S9, S11, and S13 are prepared based on the dilution of S1 solution 4 times, 7 times, 9 times, 11 times, and 13 times, respectively. All samples exhibited a turbidity level of 300 NTU, indicating the presence of a pseudo-suspended solids mixture consisting of kaolin (250 mg/l) and montmorillonite (250 mg/l). The quicklime (CaO) was bought from a commercial and was used to adjust pH.
2.2. Experiment
The prepared samples are placed under the stirring by Velp FC4S with a speed of 60 rpm, then slowly added CaO until the solutions reach the desired pH (6.0, 6.5, 7.0, 7.5, 8.0). After that, the water samples were filtered precipitates again and adjusted to the desired pH (by CaO). Water samples were allowed to settle for 30 min, and the turbidity of water samples after HACH 2100Q measured the reaction. Definitively, the treated ASW was sent to analyze the residual contents of the processed ions by ICP -AES at the Research Centre for Environmental Monitoring and Modeling.
3. Results and discussion
3.1. CaO demand
The appropriate amount of CaO used in this study shows in Table 1. It is clear that there is a marked difference between stock solution and diluted solutions in CaO demand (up to 237.30 mg to raise the S1’s pH and only smaller than 12.74 mg for S13). In addition, there is a similar change in the tendency to use less CaO as the AS concentration decreases gradually.
|
Samples |
pH = 6 |
pH = 6.5 |
pH = 7 |
pH = 7.5 |
pH = 8 |
|
|
|
|
|
|
|
|
|
|
|
|
|
|
|
|
|
|
|
|
|
|
|
|
|
|
|
|
|
|
|
|
|
|
|
|
|
|
|
|
|
|
Table 1. Amount of CaO needed to raise the pH of ASW to different pH values (unit: milligram)
Moreover, two discernible differences existed between the stock solution and its dilutions. The areas around ASW contaminant sources, which had extremely low pH (2 - 3), needed nearly 600 mg CaO per liter of ASW to increase to 6 or 6.5 and perhaps almost a half more if it grows to 7.5 or 8. Besides, the demand for most of ASW, which had higher pH (2.8 - 4.6) [1], was remarkably lower, only approximately 120 mg per liter of contaminated water at most (to 6 and 6.5) and closely 600 mg per liter of water (to 7.5 and 8). Generally, the results showed an increase in the burnt lime exigency to drop pH from 6 up to 8.
3.2. Fe2+and Al3+ removal efficiency
- Fe2+ removal:
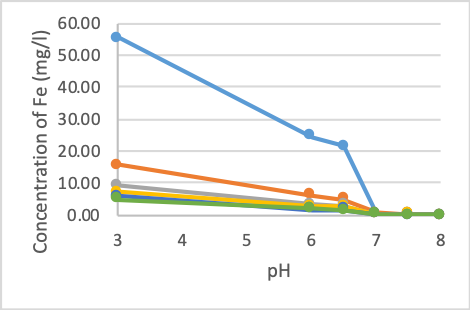
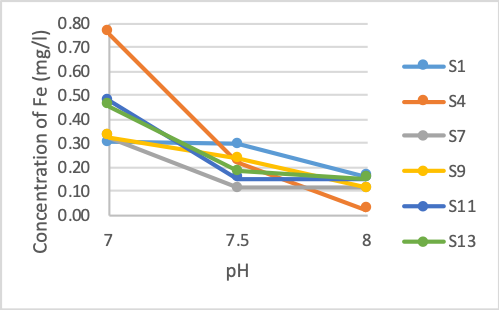
Figure 1. The concentration of Fe after treatment at different pH values
- Al3+ removal.
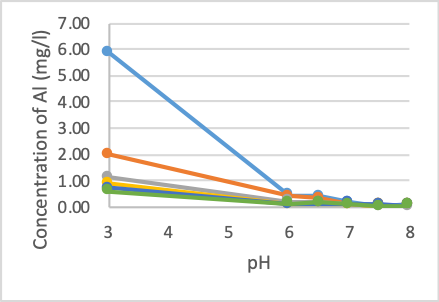
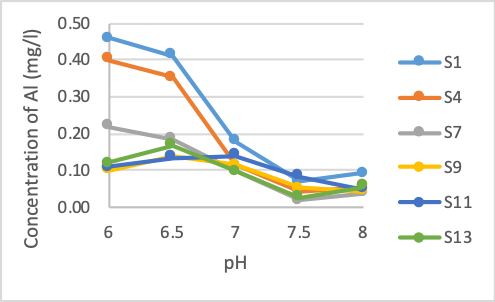
Figure 2. The concentration of Al after treatment at different pH values
Figure 1 shows that the concentration of iron at pH 6.0 decreased by about 55 - 65%. The samples showed that the rejection rates were similar. When raising the pH to 6.5, the Fe removal rate does not change much. The concentration of iron in the sample after the reaction decreases by about 10% compared to pH 6.0. However, when the pH rises to 7.0, the concentration of iron rapidly decreases. More than 90% of iron is initially removed at this pH, the iron content ranges from 0.33 - 0.76 mg/l. However, this content still exceeds QCVN 01-1: 2018/BYT (0.3 mg/l). Fe concentration continues to decrease when pH increases above 7. At pH 7.5, Fe content begins to reach the permissible standard in all cases. Initial concentration also greatly influences on Fe treatment efficiency at low pH. At pH 6 and 6.5, Fe concentrations differ greatly between high initial pollution samples and others. From pH 7.0 and above, Fe content did not vary considerably between samples.
Figure 2 shows that with the Al content at pH 6.0, about 90% Al was removed in all samples. However, in the pH range from 6 - 6.5, the two samples with the largest pollutant content, S1 and S4, still have Al content above the allowable standard (QCVN 01-1: 2018/BYT, allowed concentration of Al is 0.2 mg/l). The samples showed that, at pH greater than 7.0, Al concentration at this point met the standard. Samples with high Al concentration S1 and S4 showed a clear difference in Al concentration after treatment compared with the rest. Samples S7, S9, S11 and S13 almost met the permissible standard after raising the pH to 6 and the Al concentration in these samples did not have a clear difference.
3.3. Mn2+ removal efficiency
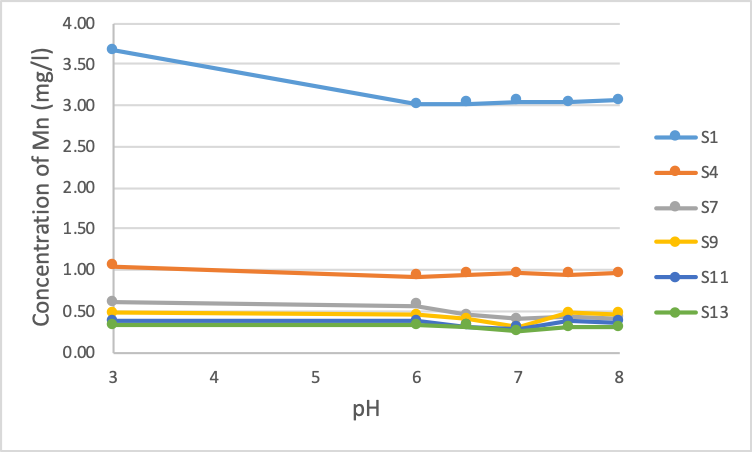
Figure 3. The concentration of Mn after treatment at different pH values
Figure 3 shows that the Manganese content in sample S1 decreased by about 18% after raising the pH to 6.0 with sample S1. However, when the pH was continuously raised above 6.0, there was no change in concentration. Similar to sample S4, the Manganese content decreased by 12% immediately after increasing the pH to 6.0. However, after that, the Manganese concentration did not change. For samples S7, S9, S11 and S13, the Manganese content does not change much when pH rises. Theoretically, Manganese (II) begins to precipitate a pH of 8.5; however, with samples S1 and S4, due to the large initial Fe content of these two samples, there is a co-precipitation reaction of Manganese with Fe, which makes Manganese decrease when pH increases to 6.0 slightly. However, after that, due to a large amount of Fe precipitated, the removal of Manganese could not continue.
3.4. SO42- removal efficiency
All samples show that sulfate was removed a pH of 6.0. It tended to increase slightly when the pH was raised from 90% to 91%. However, the amount of sulfate remaining in the water was still slightly higher than QCVN 01:2009/BYT (QCVN 01-1:2018/BYT does not specify sulfate concentrations).
4. Conclusions
A pH of 7.0, most Al and Fe were removed as over 90% of Al, Fe and sulfate could be eliminated from the solution. When increasing the pH, the concentration of Fe and Al started to dissolve, decreasing efficiency. However, a pH of 7.5, the concentration of Fe and Al just met the permitted standards. At any values of pH, a small amount of Mn was hydrolysed, which means after treatment, Mn was hardly removed from the solution. The result indicated that although traditional methods can treat Al and Fe, it is necessary for the water to have further treatment as the methods cannot eliminate Mn and sulfate completely and they also need advanced treatment.
Acknowledgements: The research funding from an independent project: code ĐĐL.CN-50/18 was acknowledged.
Phạm Hoàng Giang1, Phạm Thị Thùy1,*, Lê Thị Xuân Hòa1, Đào Phương Uyên1, Nguyễn Ngọc Lan1, Nguyễn Thị Thanh Mai2, Nguyễn Mạnh Khải1
1Faculty of Environmental Sciences, University of Science, Vietnam National
University
2Long Bien Secondary School
(Source: The article was published on the Environment Magazine by English No. I/2023)
References:
[1]. L.Q. Minh et al. (1997). Contamination of surface water as affected by land use in acid sulfate soils in the Mekong River Delta, Vietnam. Agriculture, Ecosystems and Environment, 19 - 27.
[2]. O. Hussion et al. (2000). Spatial variability of acid sulphate soils in the Plain of Reeds, Mekong delta, Vietnam. Geoderma, 1 - 19.
[3]. Z. Sebesvari et al. (2012). Agriculture and Water Quality in the Vietnamese Mekong Delta. Springer Environmental Science and Engineering, 331 -361.
[4]. Edgardo A. Auxtero and J. Shamshuddin. (1991). Growth of oil palm (Elaeis guineensis) seedlings on acid sulfate soils as affected by water regime and aluminium. Plant and Soil, 243 - 257.
[5]. J. M. Bigham and D. Kirk Nordstrom. (2000). Iron and Aluminum Hydroxysulfates from Acid Sulfate Waters. Mineralogy and Geochemistry, 351 - 402.
[6]. Michael, P. S. (2013). Ecological Impacts and Management of Acid Sulphate Soil: A Review. Asian Journal of Water, Environment and Pollution, 13 -24.
[7]. Karin Ljung et al. (2009). Acid sulfate soils and human health - A Millennium Ecosystem Assessment. Environment International, 1234 - 1242.
[8]. J. M. Bigham et al. (1996). Schwertmannite and the chemical modeling of iron in acid sulfate waters. Geochimica et Cosmochimica Acta, 2111 - 2121.
[9]. Susan A. Welch et al.. (2007). Jarosite dissolution I - Trace cation flux in acid sulfate soils. Chemical Geology, 183 - 197.
[10]. Xing Chen et al. (2020). Sources and mixing of sulfate contamination in the water environment of a typical coal mining city, China: evidence from stable isotope characteristics. Environ Geochem Health.
[11]. Yingqun Ma and Chuxia Lin. (2012). Arsenate immobilization associated with microbial oxidation of ferrous ion in complex acid sulfate water. Journal of Hazardous Materials, 238 - 245.